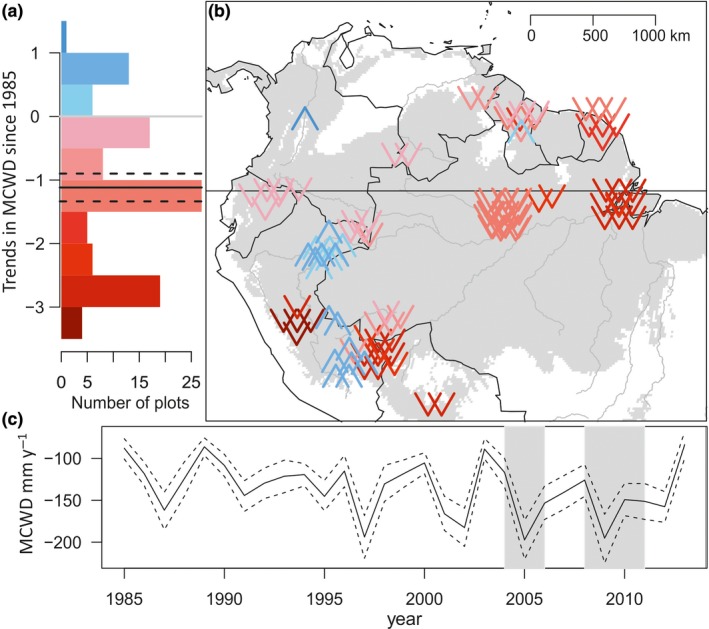
Figure 2.

Trends in maximum cumulative water deficit (MCWD) across the Amazon Basin. (a) Frequency of annual linear trends in MCWD per plot between 1985 and 2014. Note that for most plots, the climate has significantly shifted towards more negative MCWD values. Mean change and 95% confidence intervals (black solid and dashed lines) across our plots weighting plots by plot area were calculated using a bootstrap procedure by resampling the trends in MCWD from all plots 10,000 times with replacement. (b) Distribution of annual linear trends in MCWD per plot. Arrows pointing down (in red) represent locations where MCWD has become more negative over time, that is the dry season has become more intense. Arrows pointing up (blue) represent less negative values of MCWD meaning that moisture stress decreased. The intensity of the colours in (a,b) represent the strength of the climate trend. Note the difference in scale between drying and wetting trends colour bars. (c) Mean annual MCWD across plots, and 95% CI from resampling among all plots, note lower MCWD values at 2004–2005 and 2009–2010 (grey‐shaded rectangles)
