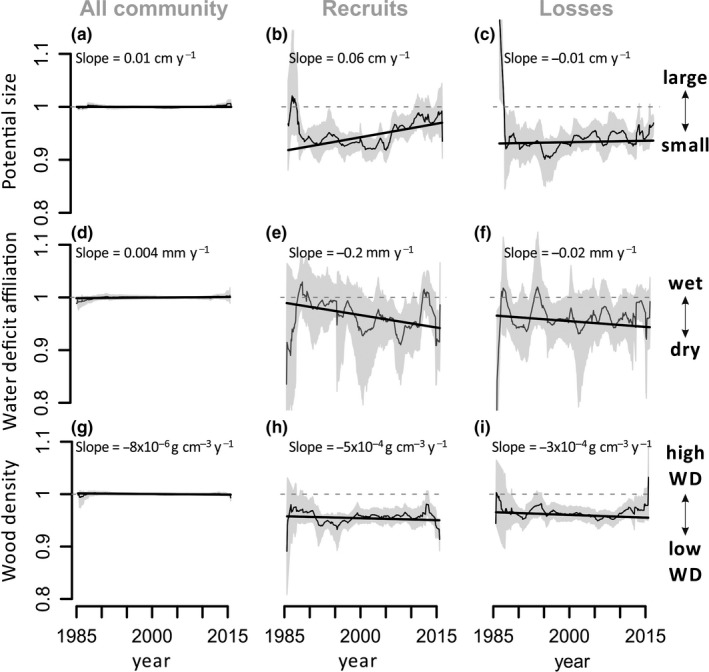
Figure 3.

Trends in functional composition between 1985 and 2015 across Amazonia. The y‐axes show stem‐based community weighted mean (CWM) trends in (a–c) water deficit affiliation (WDA), (d–f) potential size (PS) and (g–i) wood density (WD) at genus level. Values are standardized with respect to the whole plot population to allow comparison among traits meaning that the value for the whole community in the first census is equal to 1. CWM trends are shown for the whole community (a,d,g), recruits (b,e,h), and losses (c,f,i). Grey line and grey‐shaded area show standardized mean and 95% CI census‐level CWM, which can be influenced by some switching of plots assessed through time. Trend lines show linear mixed models (LMM) considering the slope and intercept of plots as random effects. Slope values for LMM are shown in each graph—these are not standardized by plot population and are shown at a different scale for each trait
