
Fig. 1.
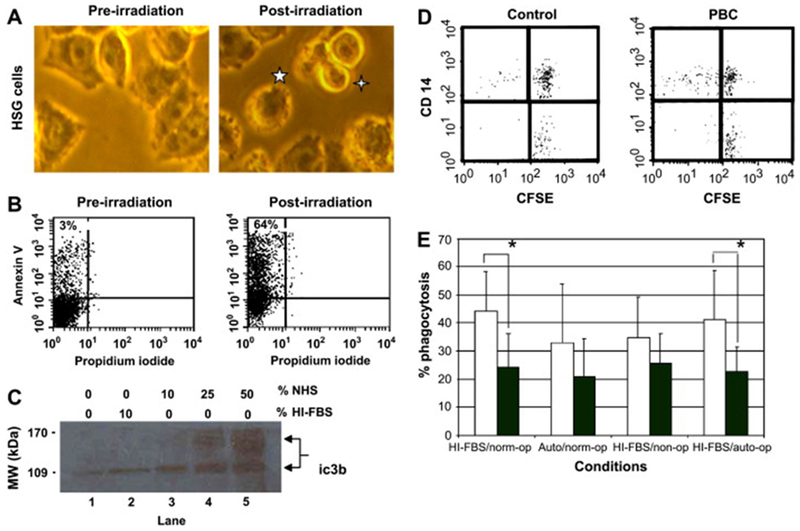
Monocyte derived macrophage (MDM) phagocytosis of apoptotic HSG under different conditions. (A & B) Evaluation of target cell apoptosis. Microscopic assessment of apoptosis of target cells before (A, left panel) and 18h after (A, right panel) UV-B irradiation. A typical apoptotic cell with membrane blebbing (5-pointed star) and an apoptotic body (4-pointed star) are denoted in the right panel (20× objective). Flow cytometric assessment of external phosphatydylserine staining of non-permeabilized target cells by PE-conjugated Annexin V before (B, left panel) and 18h after (B, right panel) irradiation of target cells with UV-B light. Apoptosis induction was confirmed by detection of an increased percentage of annexin V+/PI− (apoptotic) target cells after UV-B irradiation. This analysis was repeated prior to each phagocytosis experiment. Representative images are shown. (C) Evaluation of opsonization efficiency. Immunoblot detection of iC3b attachment to UV-B irradiated target cells after incubation with varying concentrations of normal human serum (NHS) and HI-FBS for 1h at 37C. Student’s t test was used to compare iC3b bands by densitometry. P values ≤ 0.050 were considered significant. No significant increase in iC3b attachment was noted after incubation with 10% HI-FBS (lane 2) compared to no serum (lane 1). Incubation in 25% normal human serum significantly increased iC3b attachment to UV-B irradiated HSG (lane 4). The experiment was repeated three times and a representative image is shown. (D) Two-color flow cytometry was used to evaluate phagocytosis by MDM (CD14+) of apoptotic HSG cells (CFSE+). Dual stained cells (upper right quadrant) indicate MDM that have phagocytosed an apoptotic cell. MDM that have not phagocytosed an apoptotic cell are represented in the upper left quadrant. Non-apoptotic HSG and non-phagocytosed apoptotic HSG are depicted in the lower right quadrant. Representative control (left panel) and PBC (right panel) flow cytometry images are shown. (E) Mean % phagocytosis ± std. dev. of apoptotic cells by control (white) and PBC (black) MDM after culture in media supplemented with HI-FBS or autologous serum (Auto). Apoptotic target cells were opsonized with normal serum (norm-op), no serum (non-op), or autologous serum (auto-op) prior to culture with monocyte derived macrophages. Control MDM % phagocytosis was significantly greater than PBC MDM % phagocytosis with respect to phagocytosis of opsonized apoptotic cells after MDM culture in HI-FBS. The presence of autologous serum did not significantly alter PBC MDM phagocytosis. A * indicates a statistically significant difference by student’s t test (p ≤ 0.050). Duplicate wells were used for each condition.