
Figure 3. The effect of VPA treatment on uninfected MEFs.
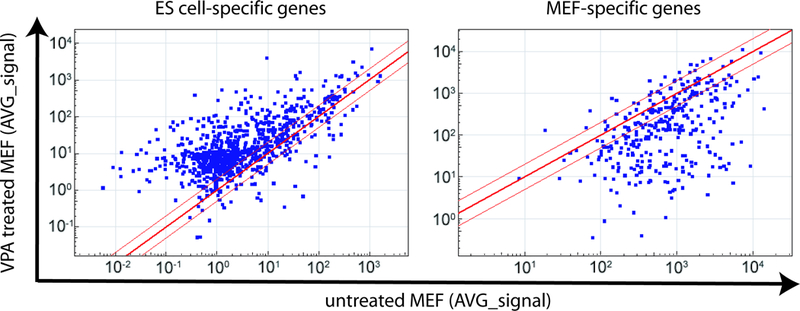
Microarray data were obtained from ES cells, iPS cells, untreated MEFs and MEFs treated with VPA. Genes that were specifically expressed in ES cells and MEFs (>10 fold difference) were selected, and scatter plots were generated to visualize the effect of VPA treatment on the expression of these genes. Red lines indicate the linear equivalent and two fold changes in gene expression levels.