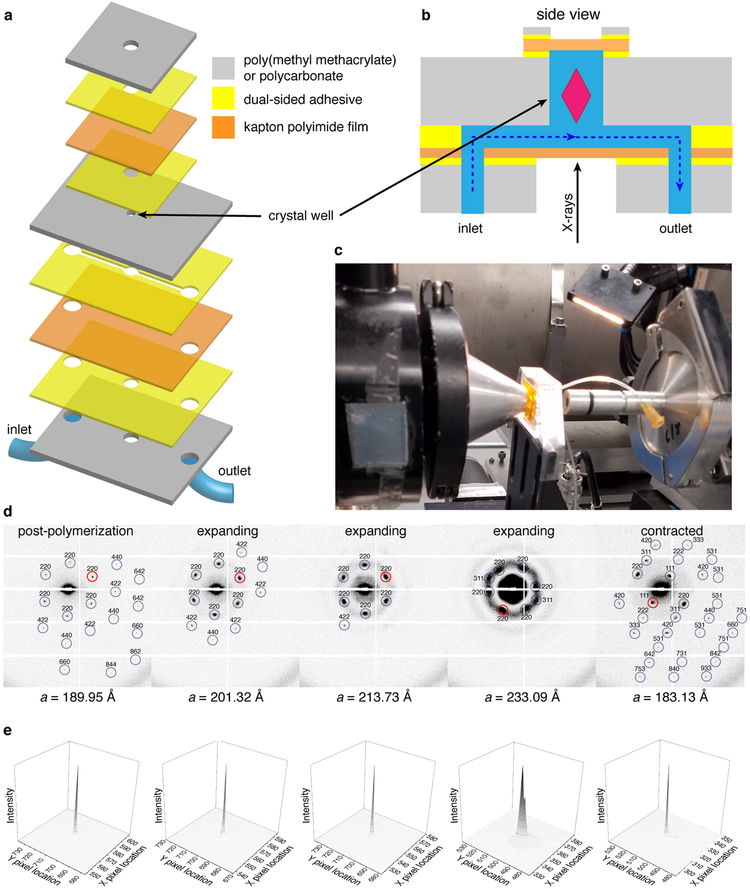
Extended Data Fig. 8 |. SAXS imaging of a single crystal-hydrogel hybrid in a microfluidic chip.
a, Schematic diagram of the microfluidic chip. b, Side-view representations of the microfluidic chip. c, Photograph of the microfluidic chip, mounted on beamline 4–2 at SSRL. d, Single-crystal SAXS diffraction patterns observed at different stages of crystal expansion and contraction. The Miller indices of each visible spot are indicated. Reflections with the highest signal-to-noise ratio (I/σl) are circled in red. e, Spot profiles of the highest-I/σI reflections indicated in d.

