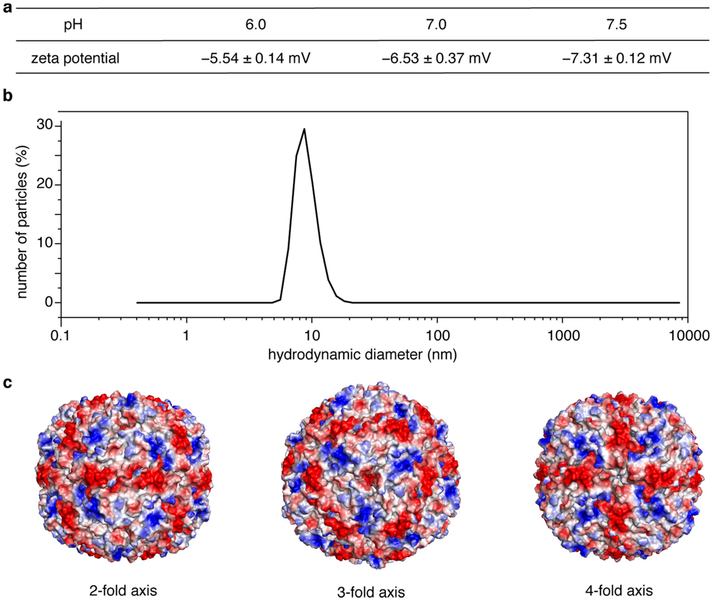
Extended Data Fig. 1 |. Distribution of electrostatic charge on the surface of ferritin and size distribution of ferritin in solution.
a, pH-dependent zeta potentials of ferritin, determined by dynamic-light-scattering measurements. b, Dynamic-light-scattering profile of ferritin (200 μM) in a solution of 50 mM HEPES (pH 7.0). c, Representation of the electrostatic charge distribution on the ferritin surface, as viewed along the two-, three- and four-fold symmetry axes. Positive (+5kBT/e) and negative (−5kBT/e) charges are shown in blue and red, respectively. kB, Boltzmann constant; e, electron charge.

