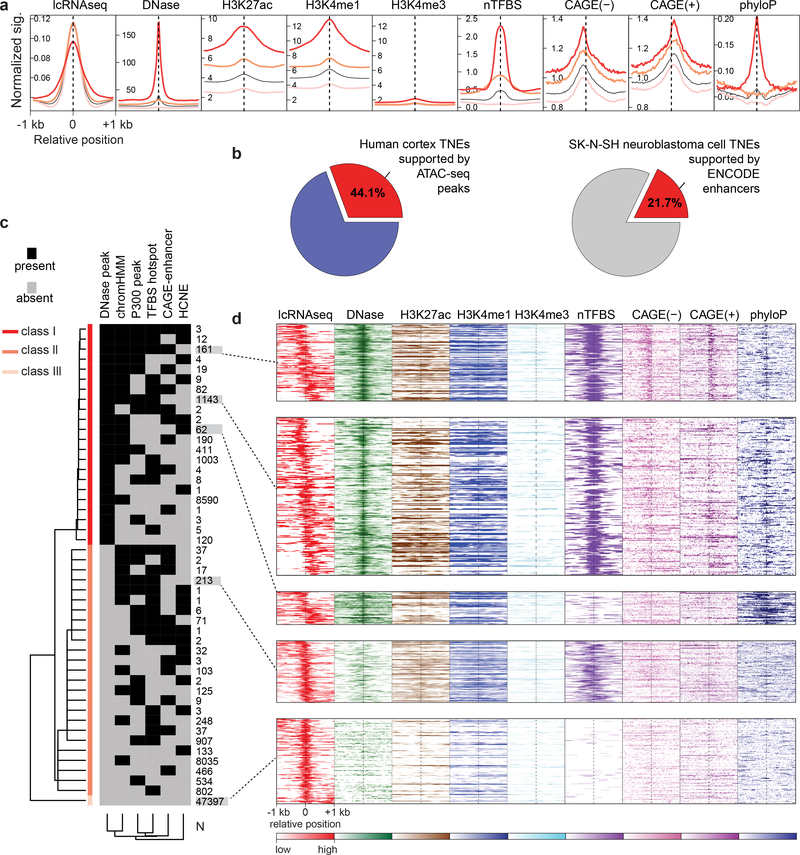
Figure 2. Transcribed noncoding elements (TNEs) identify putative enhancers active in dopamine neurons.
a, TNEs in dopamine neurons are, in part, supported by epigenetic and genetic features of active enhancers. The aggregation plot visualizes normalized signals for DNase I hypersensitivity sites (DHS), histone modification marks (H3K27ac, H3K4me1, and H3K4me3), transcription factor binding sites ‘hotspots’ (nTFBS), CAGE signals (forward and reverse strand), and sequence conservation score (phyloP) in the [−1000, +1000]bp regions centered on the DHS peak (if any) or middle position of TNEs. TNE with multiple supportive enhancer features are shown as red line (class I); TNE with one supportive feature are shown with a pink line (class II), and TNE previously not identified by published histone- or CAGE-enhancers are shown light pink (class III). The black line indicates the aggregation plot for all three TNE classes combined. b, TNEs significantly overlapped with putative enhancers predicted by other methods applied to the same human brain samples and to the same human dopaminergic SK-N-SH neuroblastoma cell line (P < 2.2 × 10⁻¹⁶ by permutation test). c, 71,022 dopamine neuron-TNEs were clustered into three classes (rows) according to the presence or absence of supporting features of active enhancers (columns) such as DHS, P300 peak, enhancer chromatin state (chromHMM), transcription factor binding sites (TFBS) hotspot, CAGE-enhancer, sequence conservation from external databases as described above. d, The heatmaps visualize TNEs with distinct combinations of epigenetic and genetic enhancer features. The relative abundance of TNEs (rows) in dopamine neurons as measured by lcRNAseq (red, relative abundance is color-coded) and physically co-localizing signals of supportive epigenetic and genetic enhancer features (the relative abundance of each supportive enhancer features is color-coded) is shown for the same [−1000, +1000]bp window as above.

