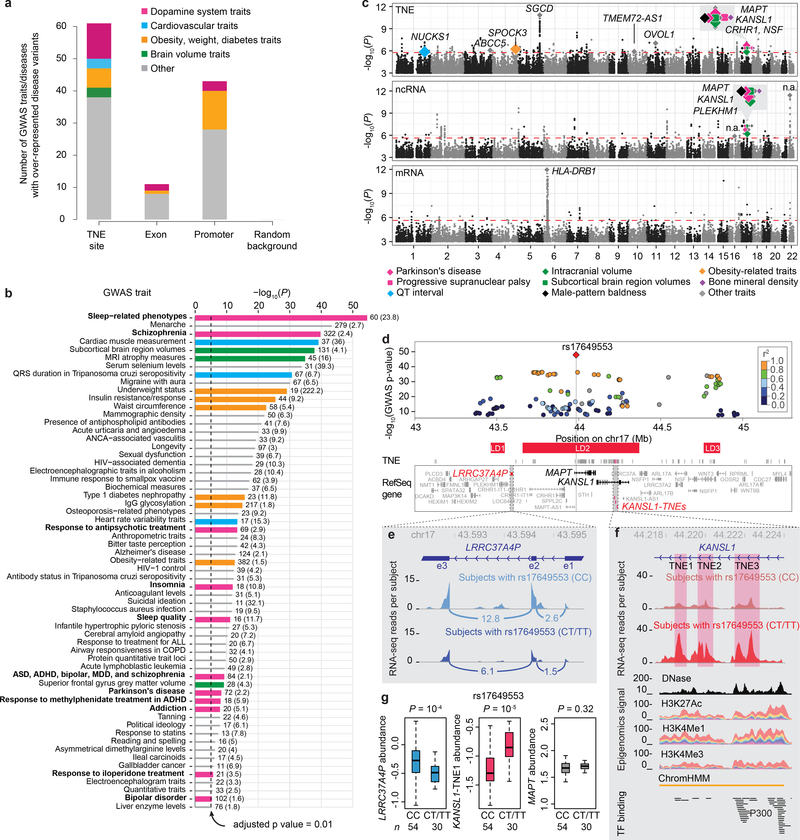
Figure 5. Putative enhancers active in dopamine neurons link genetic variation to neuropsychiatric disease.
a, GWAS diseases and traits with variants significantly enriched in dopamine TNEs, exons, promoters, and random background regions. Variants for 61 diseases and traits were enriched within TNE-defined putative active enhancers in dopamine neurons with P values below the Bonferroni-corrected significance threshold of 9.64 × 10⁻⁶ by one-sided Fisher’s exact test compared to 71,022 random genomic background regions (see Online Methods). The largest share of traits (N = 11) enriched within putative active enhancers clustered around perturbations of the dopamine system (strawberry color). By contrast, only 43 traits were enriched in promoters (including two involving the dopamine system), 11 in exons, and none in random background regions.
b, Diseases and traits significantly enriched in TNE-defined putative enhancers in dopamine neurons. Variants associated with eleven diseases or medications perturbing the dopamine system (horizontal strawberry colored bars) were dramatically over-localized in dopamine neuron TNE. The number of disease-variants colocalizing to dopamine TNEs for each trait as well as odds ratios (in parenthesis) are shown next to each bar. x-axis, P-values by one-sided Fisher’s exact test (-log10 scale); y-axis, diseases and traits. ADHD, attention deficit hyperactivity disorder; ASD, autism spectrum disorder; MDD, major depressive disorder; ANCA, antineutrophil cytoplasmic antibody; ALL, acute lymphoblastic leukemia; COPD, chronic obstructive pulmonary disorder; QRS duration, a feature on an electrocardiogram.
c, Expression quantitative trait locus analysis reveals transcribed noncoding elements in synapse genes as main cell-autonomous effector of cis-acting genetic variation in human brain dopamine neurons. Manhattan plots for TNE-eQTLs (top), ncRNA-eQTLs (middle), and mRNAs (bottom) are shown. Diamonds indicate eSNPs with RTC scores ≥ 0.85, colors indicate different groups of diseases. Gene symbols of the host loci for these eSNPs are shown (n.a., intergenic regions). Y-axis, P-values of eSNP-transcript associations from Matrix-eQTL linear regression model (N = 84). A false discovery rate (FDR) of 0.05 was considered significant (indicated by the red dashed line); QT interval, another feature on an electrocardiogram.
d, Parkinson’s disease-associated variants cis-regulate a noncoding element in the KANSL1 gene in dopamine neurons. The locus plot visualizes P values (y-axis) and chromosomal location (x-axis) of genetic variants associated with susceptibility for PD in the chromosome 17q21 GWAS peak35 (chr17:43,000,000–45,300,000 in hg19). A red diamond visualizes the lead susceptibility variant rs17649553; other PD-associated variants in the locus are represented by circles (r2 with the lead SNP is color-coded). 45 Refseq genes are physically localized under this GWAS peak (box). Linkage disequilibrium (LD) blocks are shown as red horizontal bars. P-values extracted from www.pdgene.org for GWAS meta-analysis of 13,708 PD cases and 95,282 controls are shown.
e-f, Increased expression of KANSL1-TNE1 (right panel, red) and decreased expression of LRRC37A4P (left panel, blue) is seen in dopamine neurons of individuals carrying one or two copies of the risk allele (CT/TT) compared to individuals without the risk allele (CC). e, Pile graphs of average RNA-seq reads density aligning to the exon 3–2 and exon 2–1 junctions of LRRC37A4P are visualized for individuals not carrying (cyan) or carrying the risk allele (navy). f, Genomic landscape of KANSL1-TNE1 expression in non-carriers (red-brown) and carriers (red) of the risk allele. KANSL1-TNE1 is expressed from intron 2 of the KANSL1 gene (chr17_44218414_44219042). Note, nearby KANSL1-TNE2 and -TNE3 showing similar expression patterns. KANSL1-TNE1 is expressed from a chromatin state-defined enhancer. Lower tracks display DNase uniformed signal (Roadmap20), stacked H3K27ac, H3K4me1, and H3K4me3 signals (ENCODE25), chromHMM predicted enhancer based on histone modifications (Roadmap20), as well as transcription factor ChIP-seq peak clusters (ENCODE25).
g, Boxplots representing the eQTL relation between the lead PD-associated rs17649553 variant and transcript abundance of KANSL1-TNE1, LRRC37A4P, and MAPT in dopamine neurons. Box plots as in Fig. 3b. P values from Matrix-eQTL linear regression model, N = 84 biologically independent samples.

