. 2018 Oct 25;10(1):47–55. doi: 10.1039/c8sc03077d

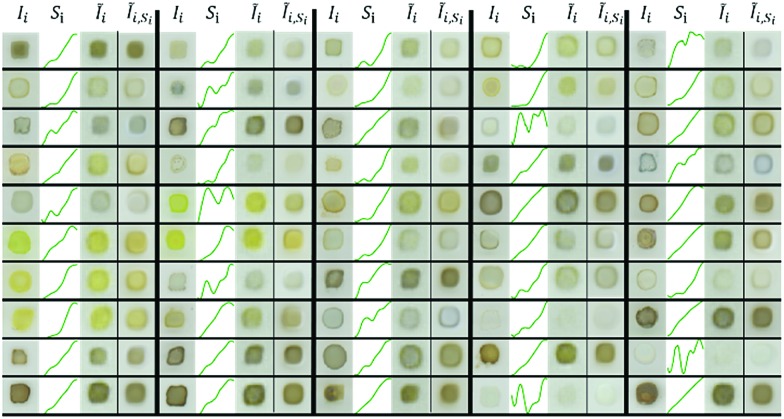
Fig. 3. Reconstruction comparison from VAE and cVAE of randomly selected images from the test set. There are 5 large columns of images separated by thick black lines, and within each of these the 4 columns of data are the measured image, measured absorption spectrum, VAE-reconstructed image, and cVAE-reconstructed image, respectfully. Both models successfully reconstruct the apparent color of the original image and aspects of the morphology (such as presence of a “coffee ring”35). Histograms of the cross entropy loss between reconstructed and measured images and for the MSE loss between predicted and measured absorption spectra are shown in Fig. S5 and S6. .

Fig. 3