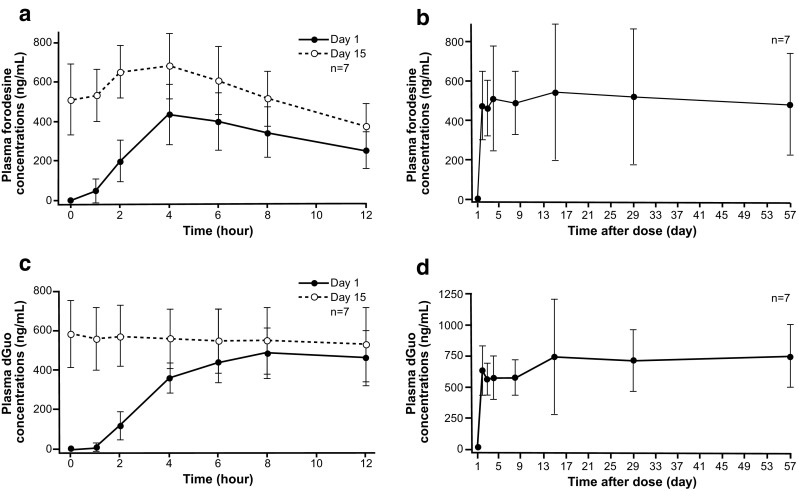
Fig. 6.

Plasma forodesine and 2′-deoxyguanosine (dGuo) concentrations. Concentration-time profile of plasma forodesine on days 1 and 15 (a), trough plasma forodesine concentrations from days 1 to 57 (b), concentration-time profile of plasma dGuo on days 1 and 15 (c), and trough plasma dGuo concentrations from days 1 to 57 (d)
