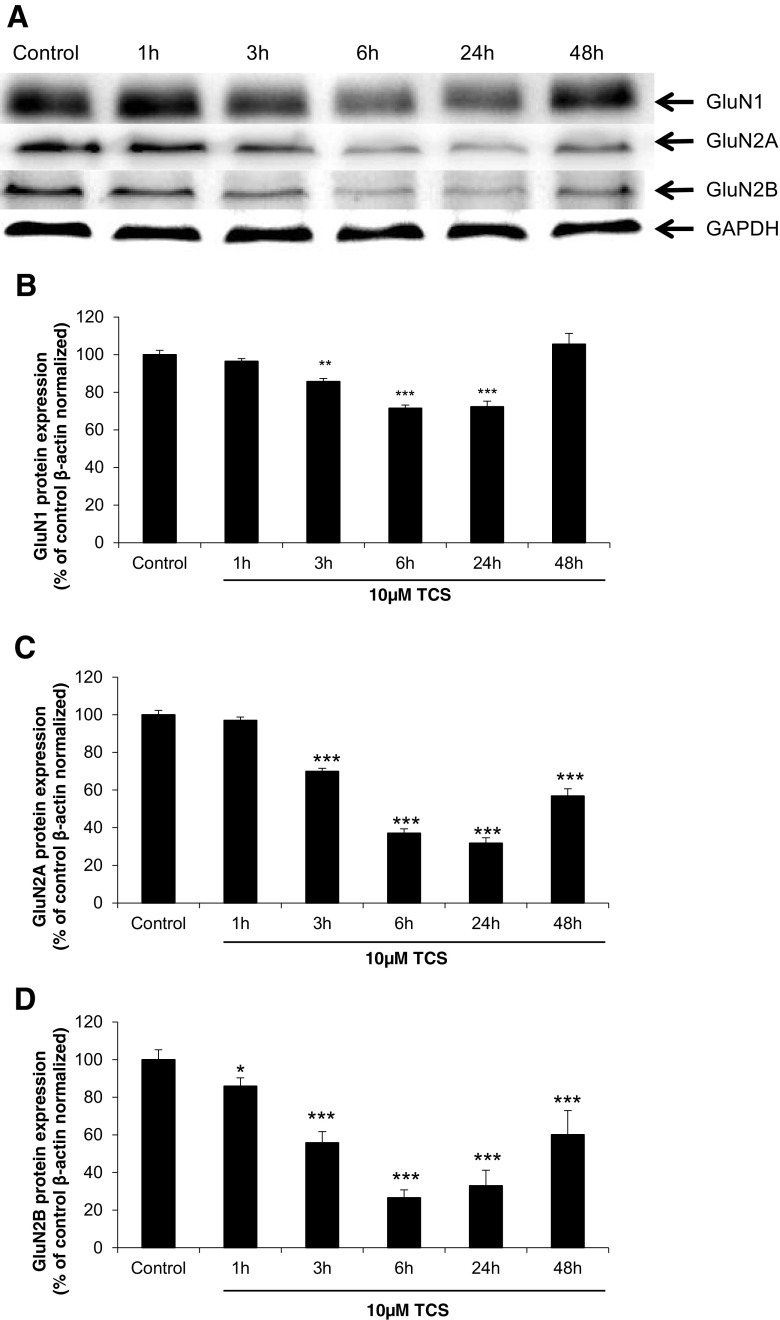
Fig. 5.
Representative Western blot of GluN1, GluN2A and GluN2B protein levels from neocortical neurons treated with 10 μM TCS after 1, 3, 6, 24 or 48 h (a). Protein bands were quantified by densitometry. The results are shown as the percentage of GluN1, GluN2A and GluN2B proteins relative to the control. Each column represents the mean ± SD of three independent experiments (b–d). The blots were stripped and reprobed with the anti-GAPDH antibody to control for the amounts of protein loaded onto the gel. **p < 0.01, ***p < 0.001 vs. the vehicle control

