FIGURE 1.

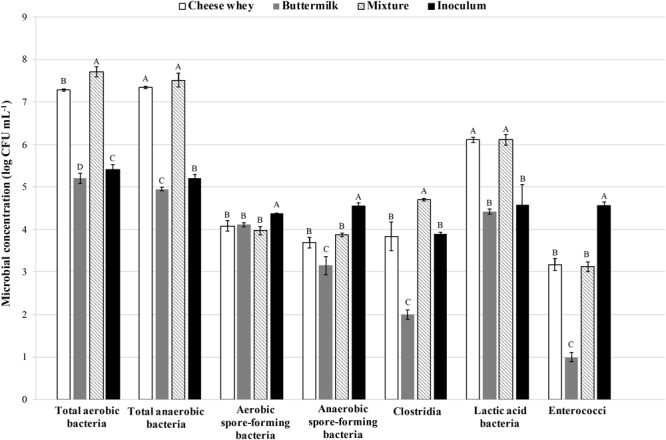
Viable counts of main bacterial groups evaluated in samples of cheese whey, buttermilk, and their mixture. The error bars represent the means ± SD of two replicates. Different letters indicate significant differences (p < 0.05).

Viable counts of main bacterial groups evaluated in samples of cheese whey, buttermilk, and their mixture. The error bars represent the means ± SD of two replicates. Different letters indicate significant differences (p < 0.05).