FIGURE 3.

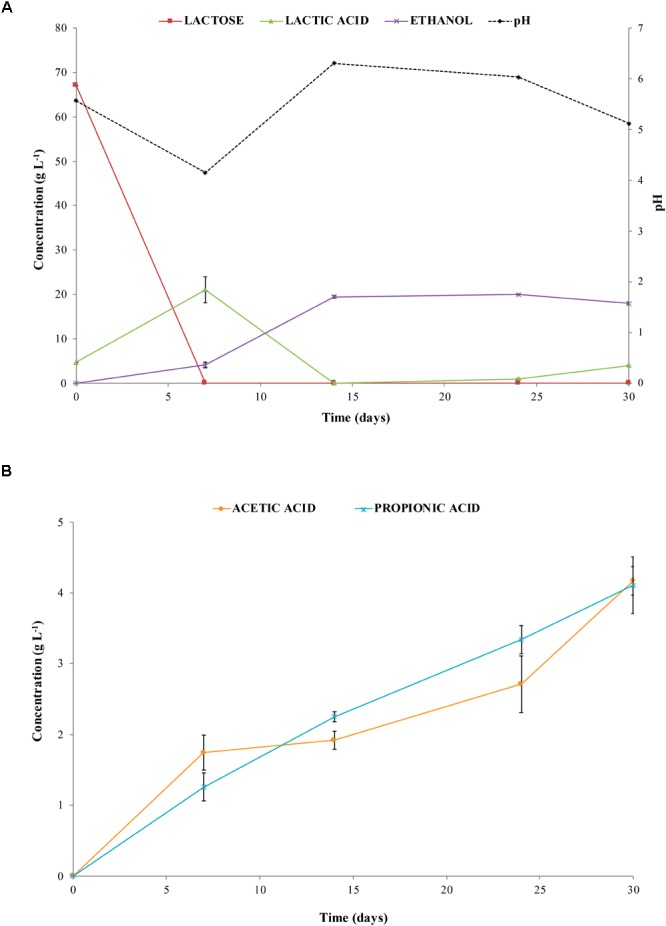
pH and concentration of lactose, lactic acid, and ethanol (A), and concentration of acetic acid and propionic acid (B) in liquid samples collected from biodigesters at different times of incubation.

pH and concentration of lactose, lactic acid, and ethanol (A), and concentration of acetic acid and propionic acid (B) in liquid samples collected from biodigesters at different times of incubation.