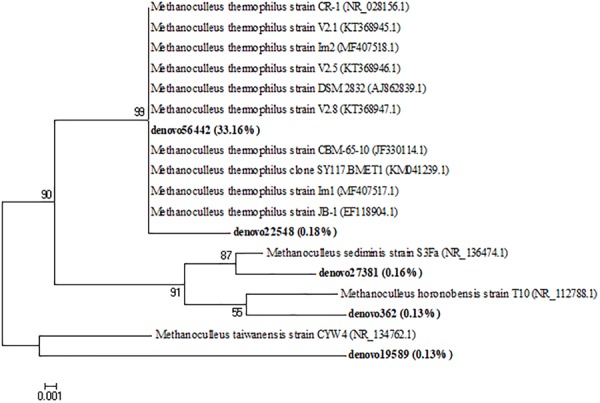
FIGURE 5.

Neighbor-joining tree for the representative Clostridiaceae and Tissierellaceae OTUs (representatives with relative abundance > 0.1%). OTUs from this study were shown in bold reporting in brackets the total relative abundance. The sequence accession numbers of reference sequences from NCBI used for the phylogenetic analysis are shown in parentheses following the species name. Bootstrap values (>50%, expressed as percentages of 1,000 replications) are given at the nodes. The scale bar estimates the number of substitutions per site.
