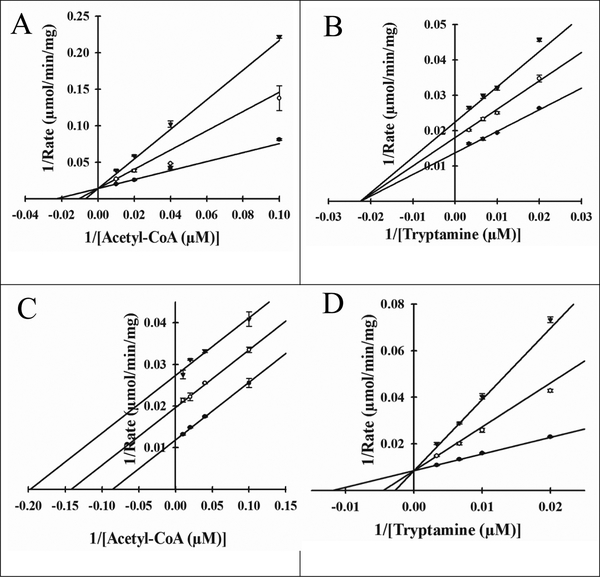
Figure 3.
Dead-end inhibition plots for Bm-iAANAT3. (A) Velocities measured at a fixed concentration of tryptamine (100 μM) with varied concentrations of acetyl-CoA (10 μM, 25 μM, 50 μM, and 100 μM), at varied concentrations of the inhibitor, oleoyl-CoA: 0 nM (●), 250 nM (◯), and 500 nM (▼); Ki = 220 ± 20 nM (B) Velocities measured at a fixed concentration of acetyl-CoA (100 μM) with varied concentrations of tryptamine (50 μM, 100 μM, 150 μM, and 300 μM), at varied concentrations of the inhibitor, oleoyl-CoA: 0 nM (●), 250 nM (◯), and 500 nM (▼), Ki = 790 ± 30 nM (C) Velocities measured at a fixed concentration of tryptamine (100 μM) with varied concentrations of acetyl-CoA (10 μM, 25 μM, 50 μM, and 100 μM), at varied concentrations of the inhibitor, tyrosol: 0 μM (●), 150 μM (◯), and 300 μM (▼); Ki = 230 ± 10 μM (D) Velocities measured at a fixed concentration of acetyl-CoA (100 μM) with varied concentrations of tryptamine (50 μM, 100 μM, 150 μM, and 300 μM), at varied concentrations of the inhibitor, tyrosol: 0 μM (●), 150 μM (◯), and 300 μM (▼); Ki = 90 ± 10 μM

