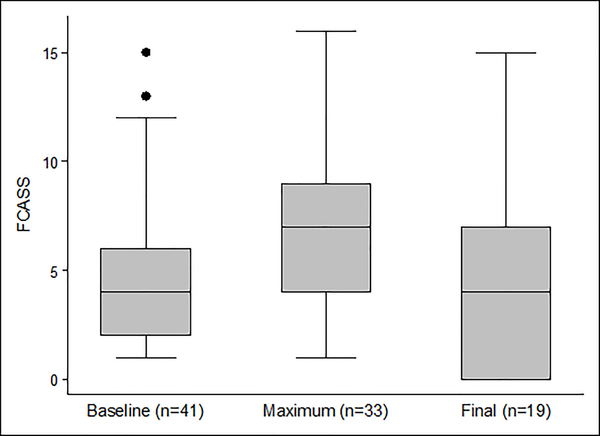
Figure 1.
Box-and-whisker plots summarizing baseline, maximum, and final FCASS scores. Maximum FCASS includes only those with follow-up imaging (n=33). Final FCASS includes only those 19 cases with follow-up imaging ≥6 months post-stroke. [Box represents interquartile range (IQR); line within box represents median; whiskers represent upper adjacent (75th percentile + 1.5*IQR) and lower adjacent (25th percentile – 1.5*IQR) values; dots represent outliers.]

