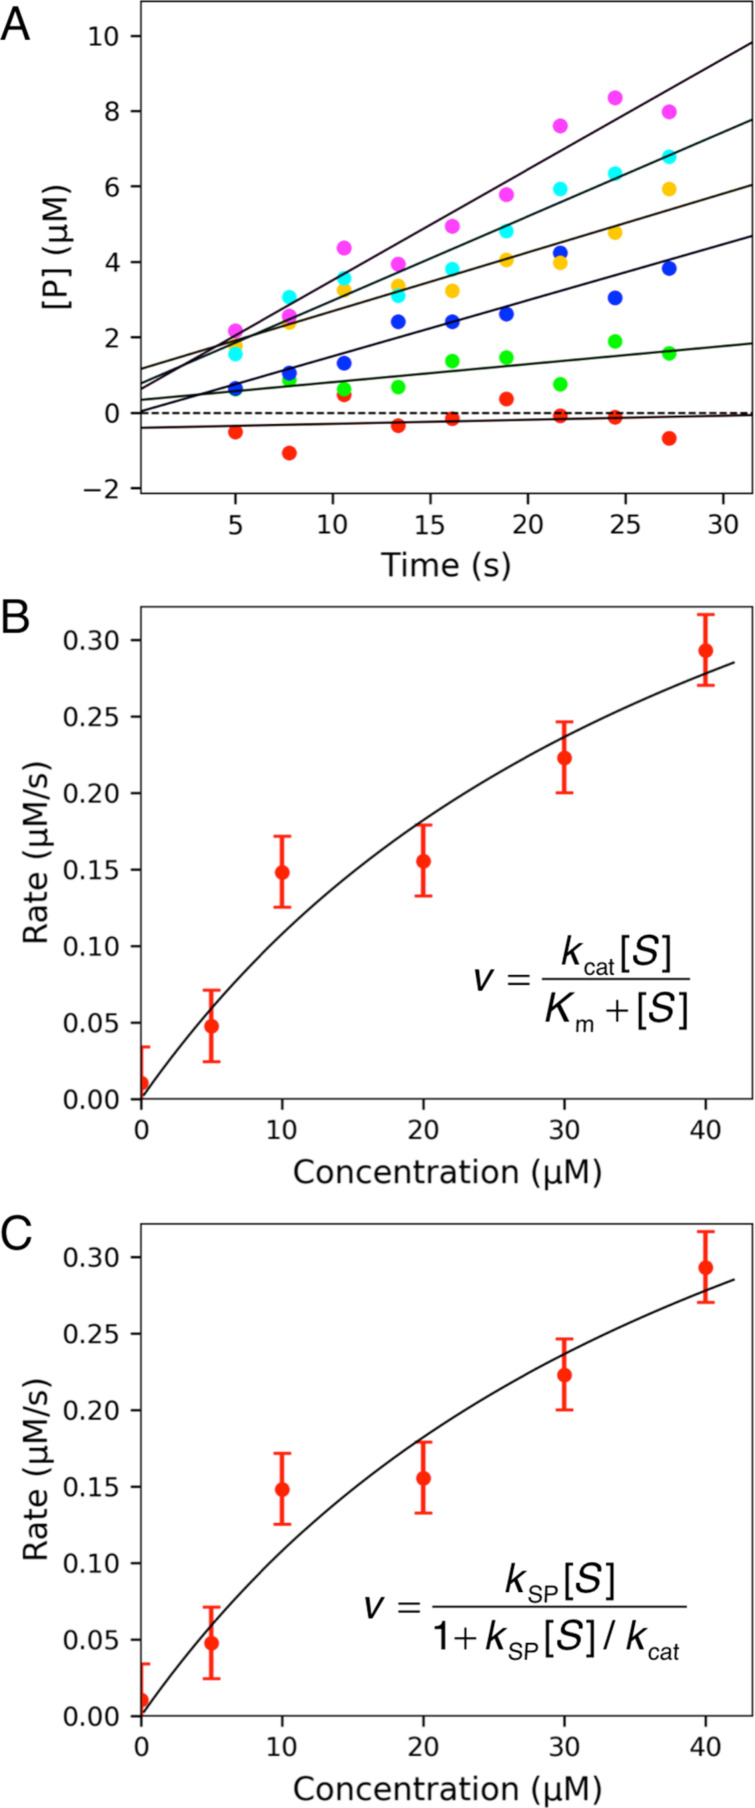
Figure 2.
Fitting data to derive kcat and Km. A) Synthetic data were fit to a straight line and then the observed rate was plotted versus substrate concentration (B, C). In B), the data were fit to standard Michaelis–Menten equation while in C), the data were fit to a modified form equation. The equations used are shown in each figure.

