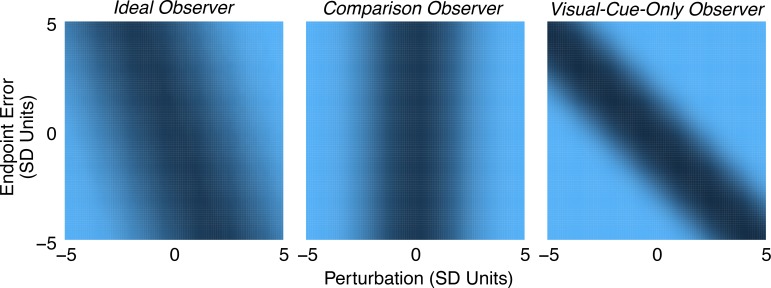
Figure 6.
Observer model fits. Probability of a Yes response as a function of perturbation and reach endpoint error as predicted by each of three models. The parameter values used for each model are from maximum a posteriori fits to the data of Subject 3 in the gain-perturbation session, indicated in Figure A1 with an asterisk. The color scale matches that of Figure 5.

