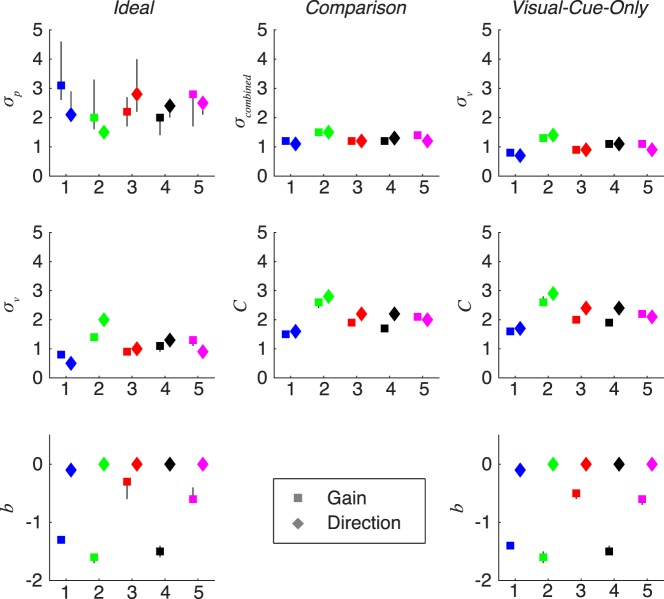
Figure 7.
MAP estimates of the parameters for each subject (indicated by x axis index), perturbation dimension, and model. Error bars: 95% CI (samples from the posterior), some of which are occluded by the MAP marker. Colors correspond to subject, as in Figure 3.

