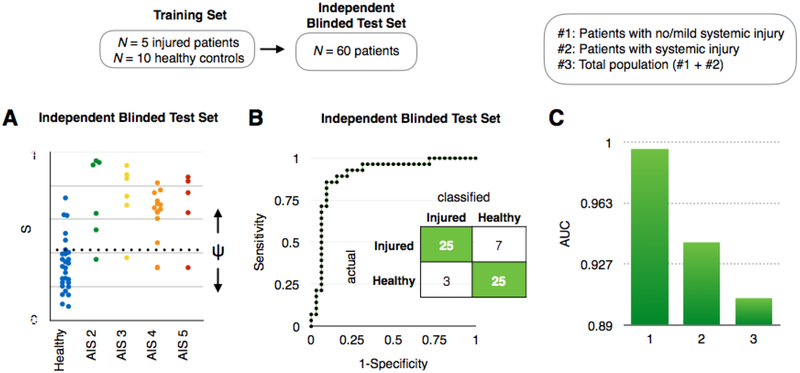
Fig. 6. Diagnosis of TBI using clinical samples.
A. The results of Linear Discriminant Analysis on a user blinded test set (N = 60), including variable injury levels (AIS 2–5), multiple time points after injury 0.4–120 hours after injury (median = 41 hours), and healthy controls. B. A Receiver Operator Characteristic (ROC) curve showing the tradeoff between sensitivity and specificity for this diagnosis. An AUC = 0.9 was achieved. Inset: A confusion matrix summarizing the results of the study. C. AUC comparison of two different subgroups (#1: patients with no/minor systemic injury, #2: patients with systemic injury) to total population (#3).

