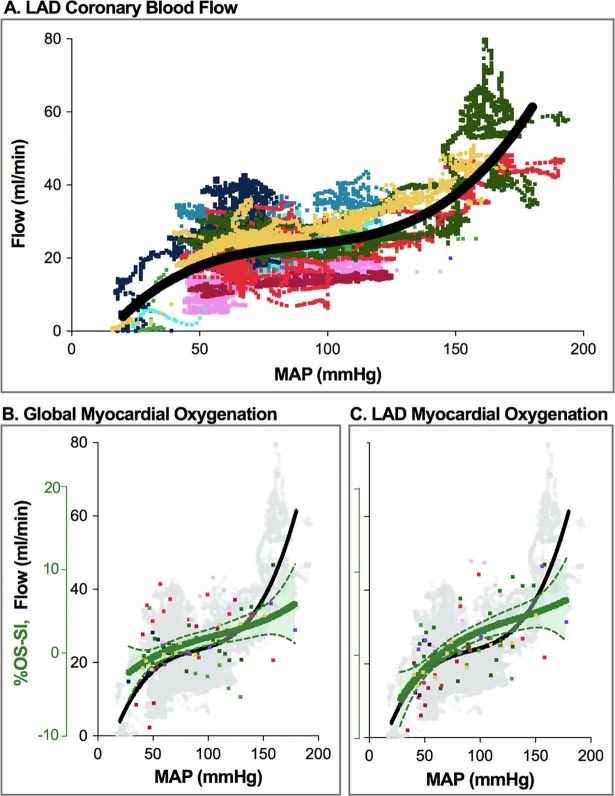
Fig 1. LAD blood flow and myocardial oxygenation across the tested range of mean arterial pressure.
A. Absolute LAD blood flow (ml/min) (n = 10 animals, each represented by a different colour). There is a plateau indicating autoregulation between MAP of 52–127 mmHg, with steeper slopes outside these limits (n = 55’368 data points). B. Global oxygenation-sensitive signal intensity (%-OS-SI) responds non-linearly to increasing MAP (n = 94). Above a MAP of 160 mmHg there was larger variation in OS-SI response. C. Regional signal intensity response is shown for myocardial territories subtended by the LAD.

