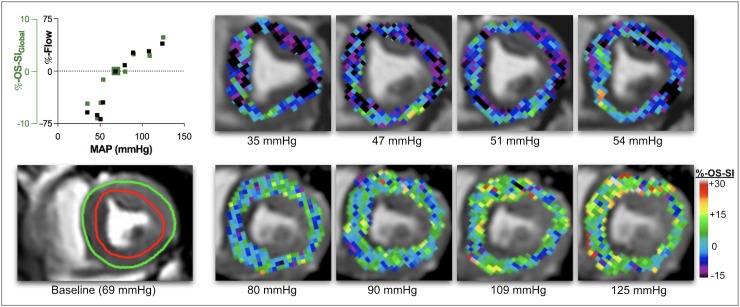
Fig 3. Myocardial oxygenation response at OS-CMR.
In this individual animal, colour maps represent percent change of signal intensity (OS-SI) in systolic OS-CMR images in comparison to baseline. At nadir MAP of 35 mmHg there is relative de-oxygenation of -6.2% (black, purple). Relative OS-SI increases to a maximum of +6.4% at a MAP of 125mmHg (green, yellow). In this animal relative OS-SI responds in close association with blood flow (top left). Colour maps are generated for visual representation only (neurolens.org). The bottom left panel demonstrates analysed myocardium (on the raw OS-CMR image, between green and red contour) in a systolic mid-papillary short-axis slice at a baseline MAP of 69mmHg.

