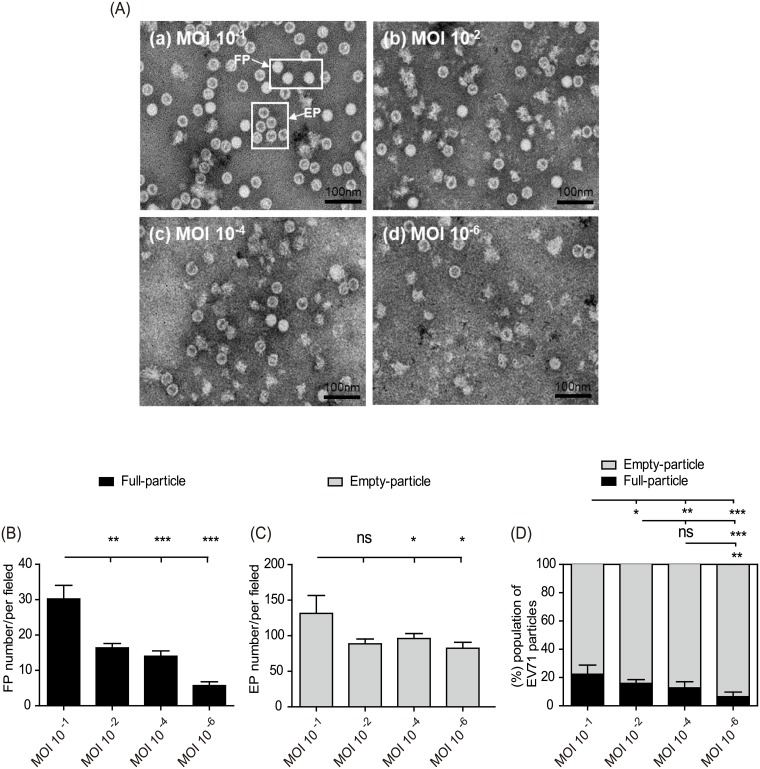
Fig 3. Characterization of FP and EP contents in EV71 vaccines with different production MOIs by transmission electron microscopy.
(A) Pooled viral particles from the vaccines prepared from (a) MOI 10−1, (b) MOI 10−2, (c) MOI 10−4, and (d) MOI 10−6 cultures were observed by TEM. The morphologies of the FPs and EPs are indicated by arrows. The total numbers of viral particles in the different MOI samples were statistically counted, and the average sums of the FPs (B) and EPs (C) per field were plotted. (D) Percent normalization of FP and EP content to the total particles from each EV71 vaccine prepared from cultures with different MOIs. The total particle number for each EV71 vaccine produced using different MOIs was set as 100%. Significant differences between groups are indicated with the following symbols: *, p<0.05; **, p<0.01; and ***, p<0.001. ns: no significant difference was present between the groups.

