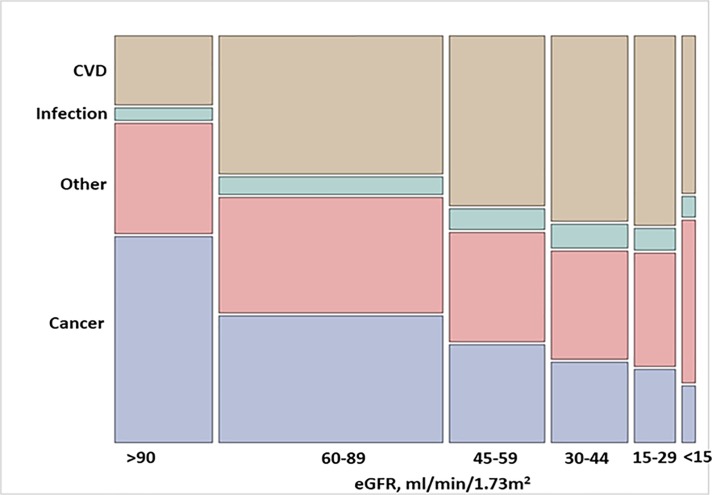
Fig 2. Unadjusted proportions of main causes of death by eGFR strata.
The height of each colored bar represents the percentage of participants for each cause of death within each category of eGFR. The width of the bar represents the percentage of participants for each eGFR category within each cause of death. The area of each colored bar represents the percentage of participants within each eGFR category and each cause of death. CVD, cardiovascular disease.

