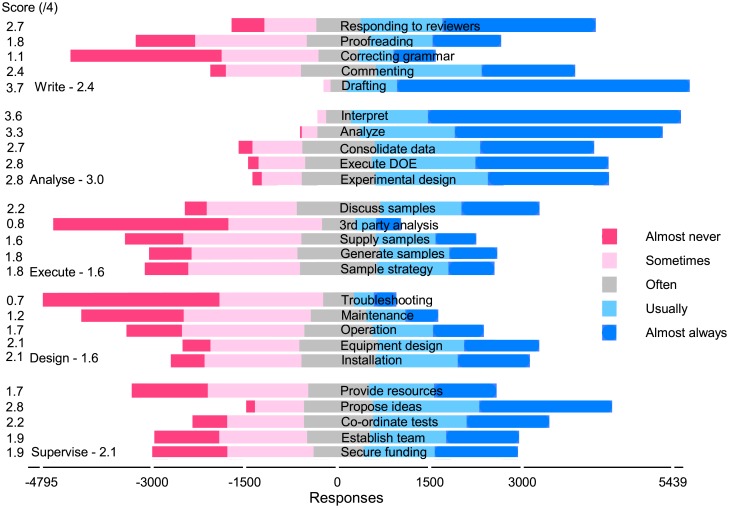
Fig 3. All fields Likert chart: 5500 respondents.
The number of responses less than zero on the x-axis include almost never (ω0), sometimes (ω1) and half of the often (ω2) responses. The number of responses greater than zero include almost always (ω4), usually (ω3), and half of the often responses. The mean scores on the y-axis are and varies from a low of 0.7 (troubleshooting) to a high of 3.7 (drafting).

