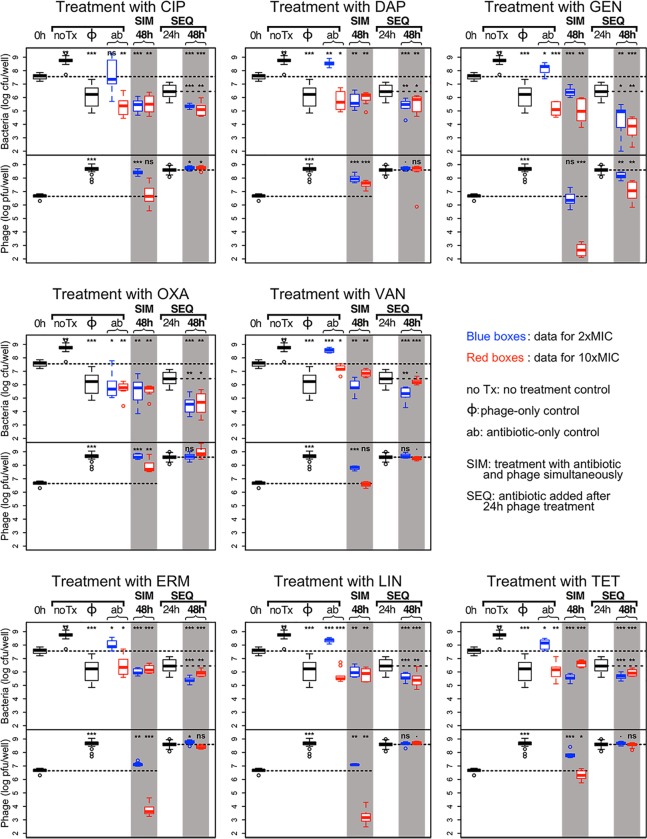
Fig 2. Combined action of 8 antibiotics and phage.
For each plot, top panel: bacterial densities; bottom panel: phage densities. Blue boxes: treatment with 2×MIC of the antibiotic; red boxes: treatment with 10×MIC of the antibiotic. Densities after 48h of combined antibiotic and phage treatments are shown in the shaded columns. For each plot we use the same controls (the left side of the plot): (i) untreated, or treated with phage only (same data for all 8 antibiotics), and (ii) treated only with the noted antibiotic for that plot. For each plot, the results for the simultaneous treatment (SIM) with phage and 2× and 10×MIC of the antibiotic are shown in the middle shaded column. The sequential treatment (SEQ), where the cultures were first treated with phage for 24 h then treated with the antibiotic for another 24 h, the bacterial and phage densities at 48 h are shown on the right shaded column. The bacterial and phage densities after 24 h exposure to phage are shown between the two shaded columns. The dashed lines across the panels indicate the initial densities of bacteria and phage. The short, horizontal broken lines in the 3 columns to the right for the sequential treatment denote the densities of bacteria (top panel) and phage (bottom panel) after 24 h exposure to phage. The significance levels of the two-tailed t-tests comparing the densities at 48 h with initial densities and with densities at the time antibiotic was added in SEQ treatment are as follows: ***: p<0.00001, **: p<0.001, *: p<0.05; ·:p<0.1 and NS: p>0.1.

