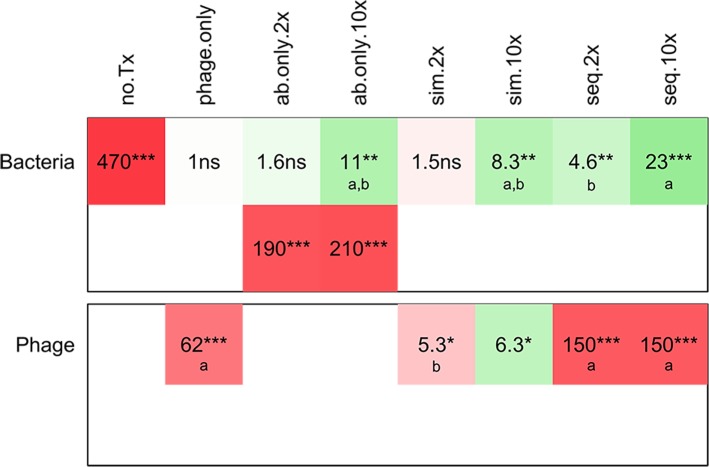
Fig 5. Summary of the effects of different treatments on the densities of S. aureus and phage using RIF.
The top row of the table shows the changes in bacterial density over 48 h compared with initial densities. For the RIF-only controls, the values for the wells that did not become turbid are shown in the top row, and the values for the wells that became turbid are shown on the second row. Otherwise, same legend as Fig 3.

