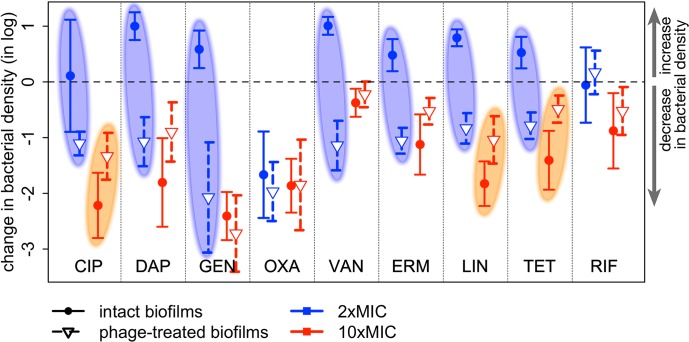
Fig 6. Change in bacterial density after adding antibiotics to intact or phage-treated biofilms.
The change in bacterial density (log(final density)–log(initial density)) is shown for all 9 antibiotics used in this study at both antibiotic concentrations. The symbols indicate the difference in means, and the error bars indicate the 95% confidence interval obtained from t-tests. Values above the dashed line show an increase in bacterial density during the course of treatment; values below the dashed line a decrease. Antibiotics added to intact biofilms are shown in solid dots and solid lines (initial densities = bacterial densities in prepared biofilms, final densities = antibiotic-only controls); antibiotics added to biofilms exposed to phage for 24 h are shown in open triangles and dashed lines (initial densities = bacterial densities after 24 h of phage-only treatment, final densities = sequential treatment at 48 h). The blue ovals highlight the 7 antibiotics used at 2×MIC that did not reduce the bacterial density when applied to intact biofilms (change in density at or above the dashed line) but significantly killed bacteria when added to phage-treated biofilms (change in density below the dashed line). The orange ovals highlight the 3 antibiotics where pretreatment with phage likely reduced the efficacy of 10×MIC antibiotic.

