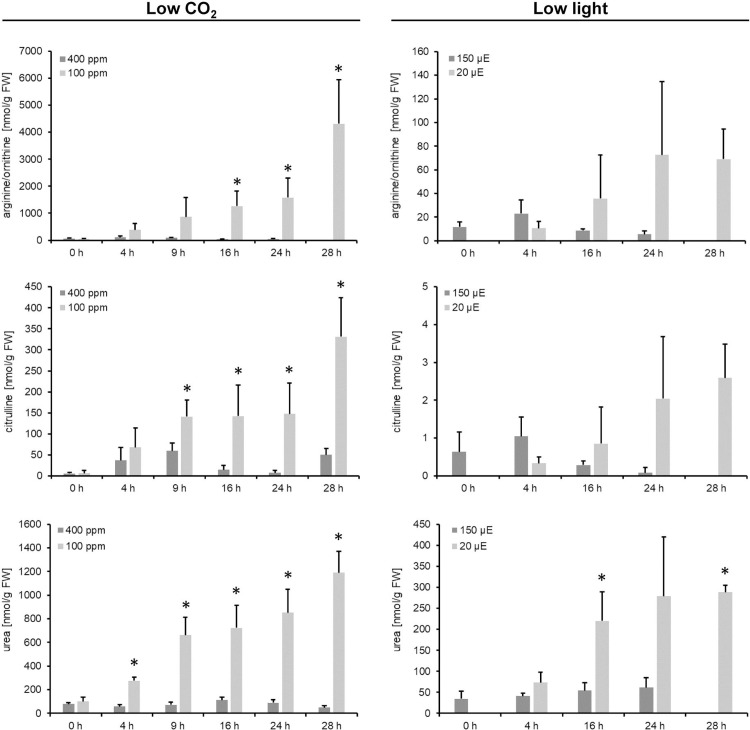
Fig 3. Log2 changes induced by either the CO2- or the light-shift in metabolites of the urea cycle.
Data is obtained by GCMS analysis. Data points represent the mean of three (light-shift) or five (CO2-shift) biological replicates ± SD. The whole data set is given in S1 File. Significance was tested according to the two-tailed Student's t-test (* p<0.05). Additionally, the level of significance of the population mean was tested by ANOVA (p<0.05). Results are listed in S1 File.

