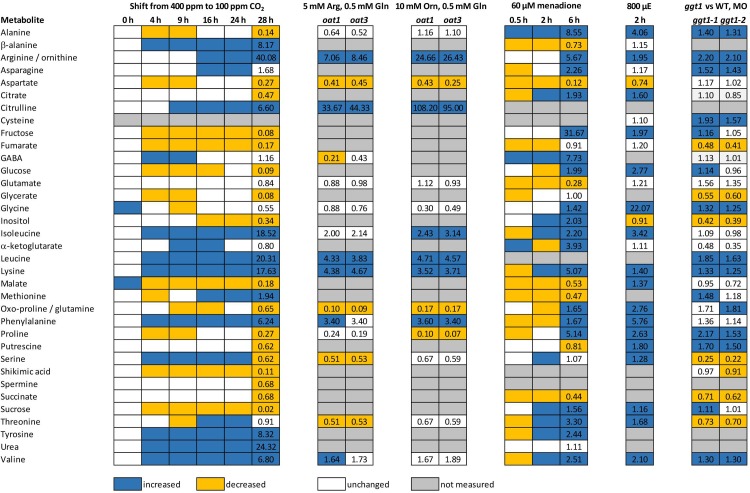
Fig 6. Comparison of metabolite changes in response to different stresses and in different Arabidopsis mutants.
Data listed were extracted from publications by Funck et al. [7] (oat mutants in response to nitrogen limitation), Florez-Sarasa et al. [29]) (high light treatment), and Dellero et al. [30] (ggt1 mutant). Significant metabolite changes were determined by Student’s t-test (p<0.05) in our study and the selected publications, respectively. Numbers in selected columns indicate fold-changes relative to the control conditions. Given that Funck et al. [7], Florez-Sarasa et al. [29] and Dellero et al. [30] provided data for both arginine and ornithine, these fold changes were averaged in order to make them comparable to our GC-MS metabolite data. oat: T-DNA insertion in the gene encoding Arabidopsis ornithine-δ-aminotransferase, Arg: arginine, Gln: glutamine, Orn: ornithine, h: hours, ggt1: T-DNA insertion in the gene encoding Arabidopsis glutamate:glyoxylate aminotransferase 1, MOD: middle of the day. Blue: significantly induced, orange: significantly reduced, white: unchanged, grey: not measured.

