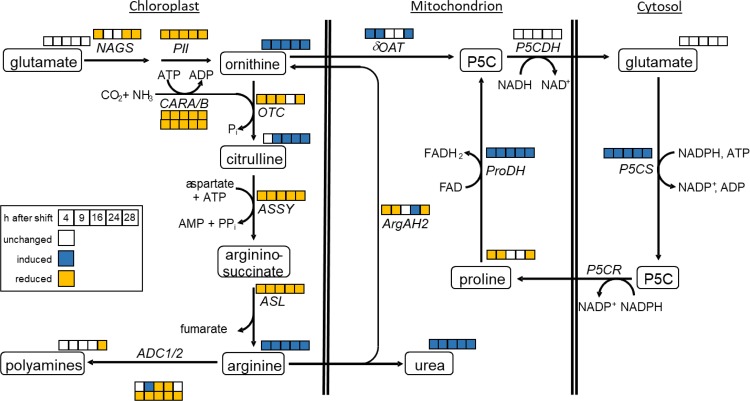
Fig 9. Integration of metabolite and transcript data of ornithine-linked pathways.
The squares indicate changes on both transcription and metabolic level in response to a CO2-shift from 400 ppm to 100 ppm (Student´s t-test, p<0.05). ADC1/2, arginine decarboxylase 1 and 2; ArgAH, arginine amidohydrolase; ASL, argininosuccinate lyase; ASSY, argininosuccinate synthetase; CARA, carbamoyl phosphate synthetase A; CARB, carbamoyl phosphate synthetase B; NAGS, N-acetyl-L-glutamate synthase; δOAT, ornithine-δ-aminotransferase; OTC, ornithine transcarbamylase; PII, PII protein; P5CDH, pyrroline-5-carboxylate dehydrogenase; P5CS, pyrroline-5-carboxylate synthetase; P5CR, pyrroline-5-carboxylate reductase; PRODH, proline dehydrogenase. Blue: significantly induced, orange: significantly reduced, white: unchanged.

