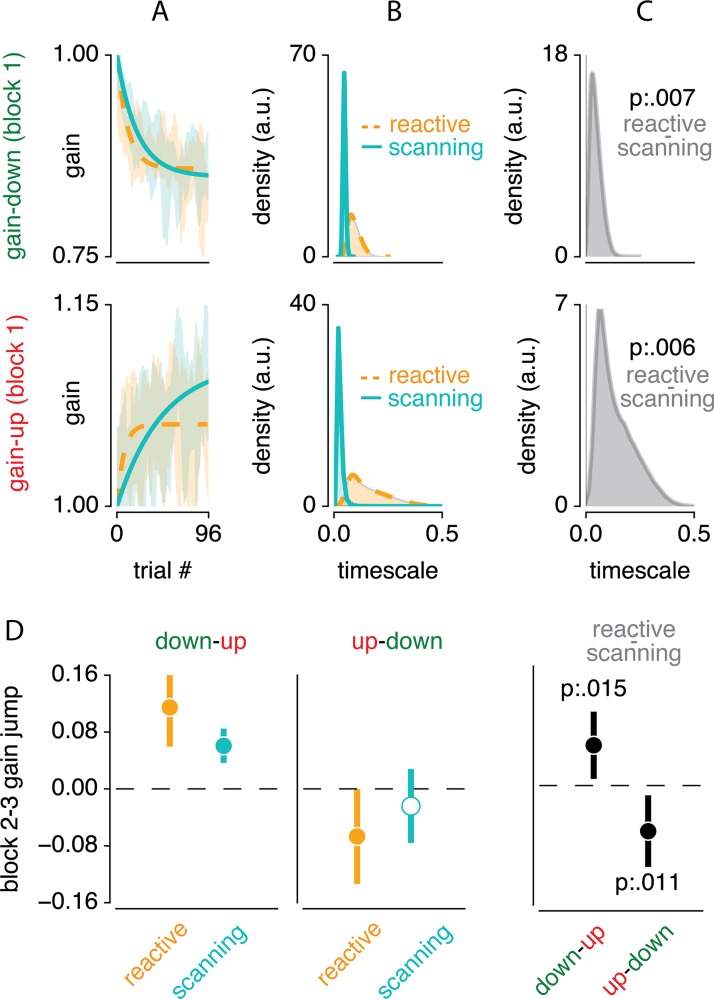
Fig 4. Indications for fast and slow process contributions.
(A) Exponential functions fitted to the first adaptation block of each condition. (B) Bootstrapped distribution of the timescale parameter across participants, for the different conditions. (C) Difference in this timescale between reactive and scanning for both gain direction conditions. This shows that reactive compared to scanning saccade adaptation occurs at a faster rate. (D) Changes in saccade gain between the average of the last 6 saccades of the second block and the average of the first 6 saccades of the third block. Results are shown for both gain direction reversals (up-to-down and down-to-up) for both reactive and scanning saccades, and for the difference between these saccade types. This shows that when adapting reactive compared to scanning saccades, adaptation changes more quickly from one to another gain-change situation.

