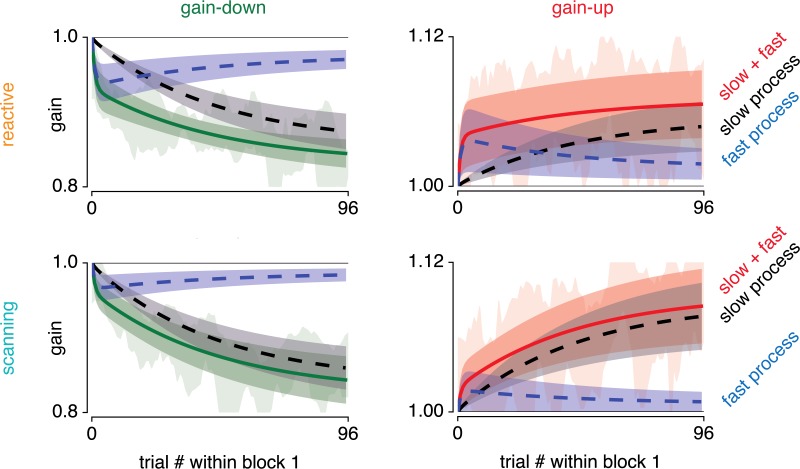
Fig 5. Dual-rate model fits to gain-up and gain-down adapted reactive and scanning saccades.
Fitted fast (blue) and slow (black) processes to overall adaptation (green when gain-down and red when gain-up) to data from the second block. Shaded areas around model fits represent the 95% CI over participants. Underlying shaded data area indicates 95% CI over participants of moving average over six trials (as in Fig 3).

