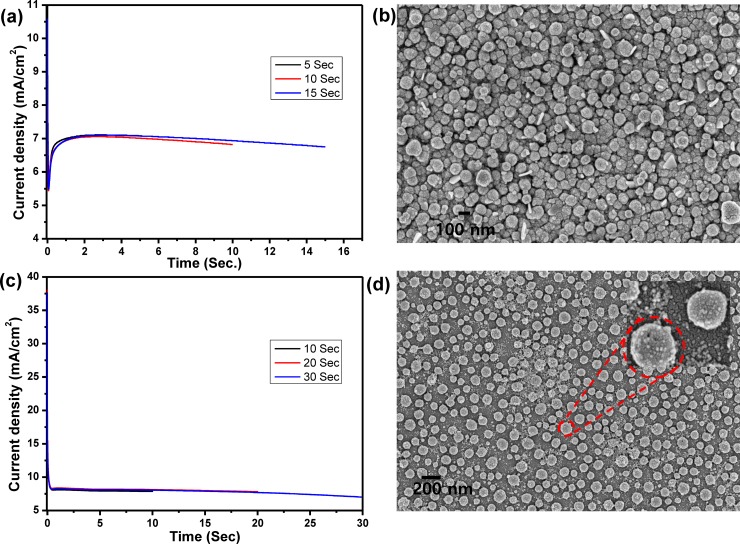
Fig 1.
(a) i-t curves for electrochemical deposition and reduction of GO for different periods (5, 10 and 15 sec), (b) SEM image for rGO nanosheets modified ITO electrode that formed after electrochemical deposition for 15 sec, (c) i-t curves for electrochemical deposition of Au NPs onto rGO/ITO electrode for different periods (10, 20 and 30 sec), and (d) SEM image for Au nanodots modified rGO/ITO electrode after 30 sec.

