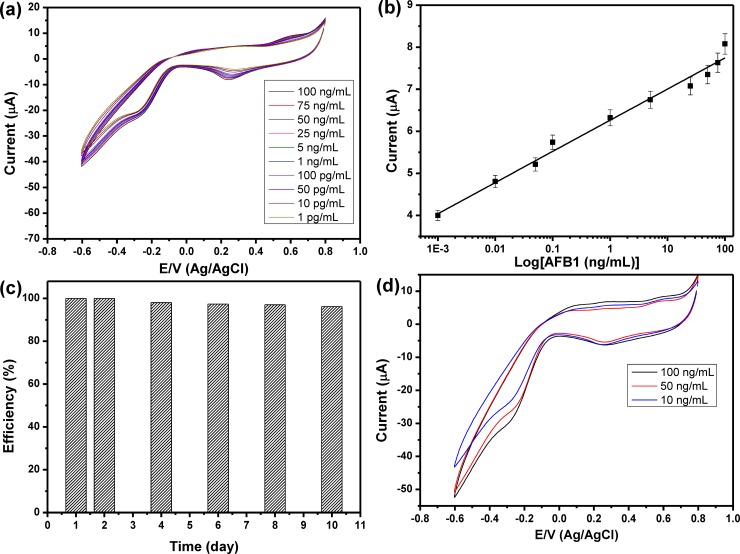
Fig 6.
(a) Cyclic voltammograms for different concentrations of AFB1, (b) relationship between the AFB1 concentrations and the cathodic current peaks, the results are the average values of three experiments, (c) the stability of developed sensor toward the detection of AFB1 over 10 days, and (d) cyclic voltammograms for monitoring different concentrations of spiked AFB1. All the measurements were performed at a scan rate of 100 mV/sec in 10 mM PBS (pH, 7.4).

