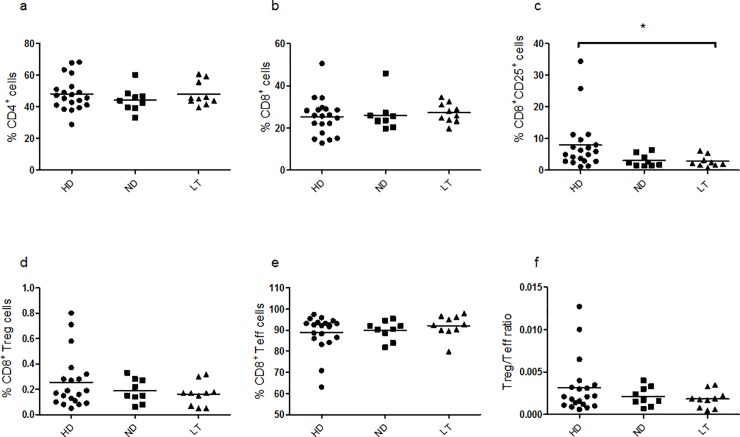
Fig 1. Frequency of cell populations relative to HD, ND and LT T1D patients under basal conditions.
Frozen stocked PBMC samples were analyzed by flow-cytometry analysis to estimate respective frequency of CD4+ (a), CD8+ (b), CD8+CD25+ (c), CD8+CD25+Foxp3+ Treg (d), CD8+CD25-Foxp3- Teff (e) cells and the Treg/Teff ratio (f). In all graphs, horizontal lines represent the mean frequency and each symbol shows an individual. Black circles depict HD, square dots represent ND T1D patients and black triangles associate to LT T1D patients. Significance was calculated in relation to the control group using as statistical test the One-way analysis of variance Kruskal-Wallis test and Dunn’s Multiple Comparison post-test. In this and following figures * p<0.05, **p<0.01, and ***p<0.001. For the investigation present in figure, 20 HD, 9 ND and 10 LT samples were studied.

