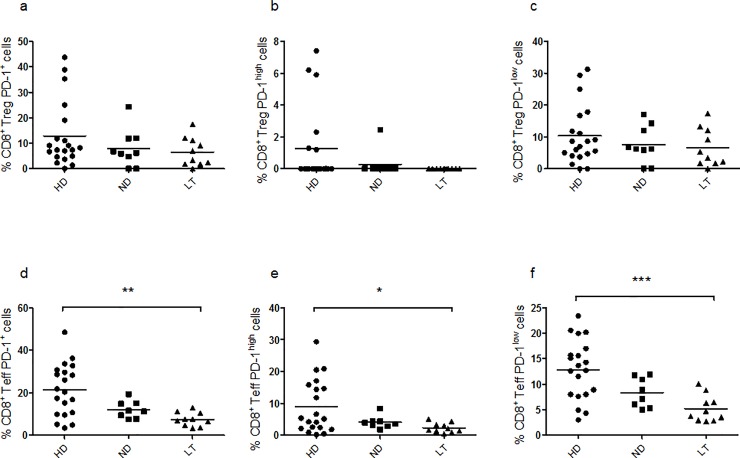
Fig 2. Frequency of CD8+ PD-1+ subsets under basal conditions.
Graphs show the percentages of CD8+ Tregs expressing PD-1 (a), PD-1high (b), PD-1low (c), and the percentages of CD8+ Teffs expressing PD-1 (d), PD-1high (e) and PD-1low (f). For the investigation present in figure, 20 HD, 9 ND and 10 LT samples were studied.

