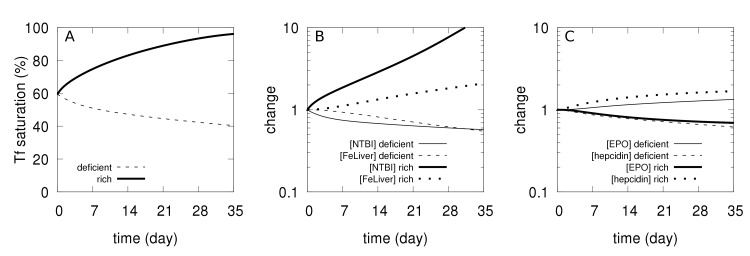
Fig 2. Simulated physiological changes during the first 5 weeks under deficient and rich iron diets.
A–Changes in transferrin saturation. B–Changes in [NTBI] and [FeLiver], relative to their value in the adequate diet (time zero). C–Changes in [EPO] and [hepcidin], relative to their value in the adequate diet (time zero).

