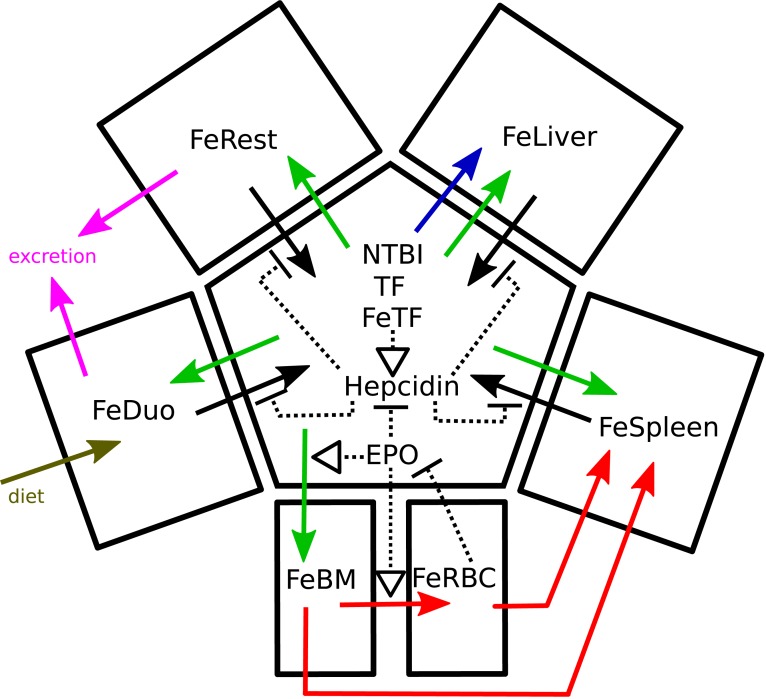
Fig 12. Overview of the model.
The central compartment represents the plasma and its species. Solid black arrows represent the export of iron to plasma via ferroportin, and these are inhibited (dashed blunted segments) by hepcidin. The effect of EPO is represented by its inhibition of hepcidin, as well as activation (dashed arrows) of iron entry into bone marrow and tRBC. RBC iron inhibits EPO production. Green arrows represent import of iron from transferrin. The red arrows represent the movement of iron in the erythroid system (differentiation of cells in the bone marrow into RBC, and recycling of RBC iron in the spleen). The blue arrow represents direct import of NTBI into the liver via the ZIP14 transporter. Magenta arrows represent iron loss and the brown arrow represents dietary import. A more complete diagram in the SBGN standard is available in S1 Fig.

