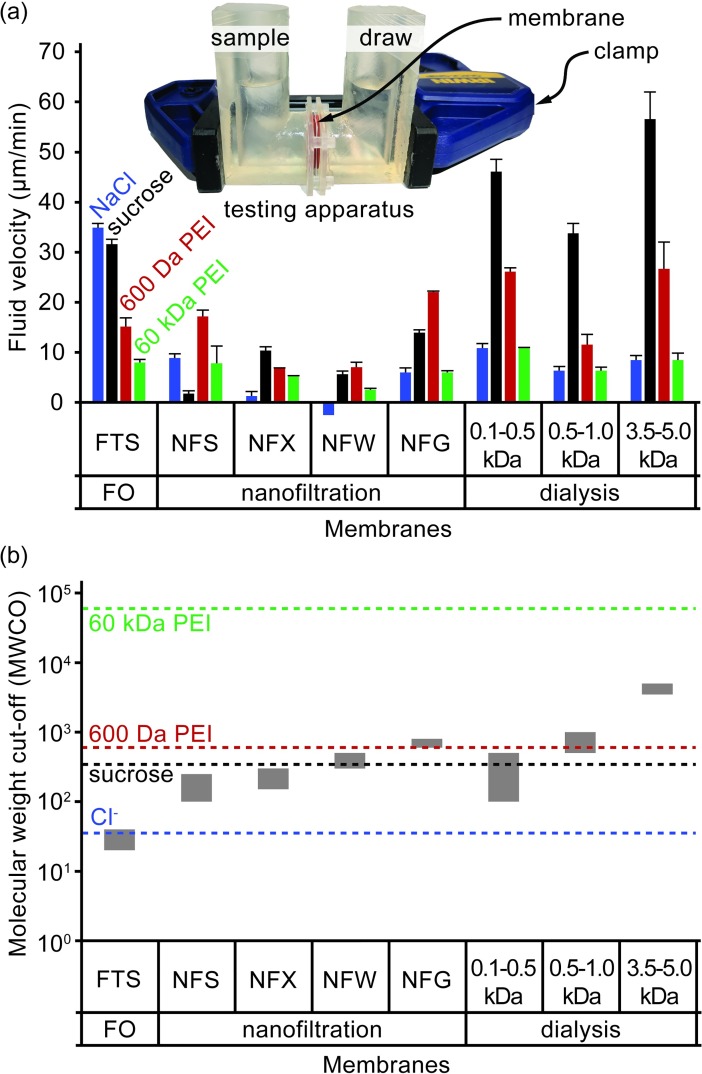
Fig 2. Testing results of membrane and draw molecule performance.
(a) The forward osmosis performance of various combinations of membranes and draw molecules. Performance metric is the average water flux over a 3 h period. Sample is 10 mL deionized water; draw osmolarity is 1 OsM. Overlay image depicts testing apparatus. (b) The MWCOs of each membrane and MW of each draw molecule is plotted together on the same graph to give insights on the size compatibility of each combination. Three membrane classes are represented: forward osmosis (FTS), nanofiltration (NFS, NFX, NFW, and NFG), and dialysis (0.1–0.5 kDa, 0.5–1.0 kDa, and 3.5–5.0 kDa). Draw molecules are NaCl, sucrose, and both low and high MW branched polyethylenimine (PEI).

