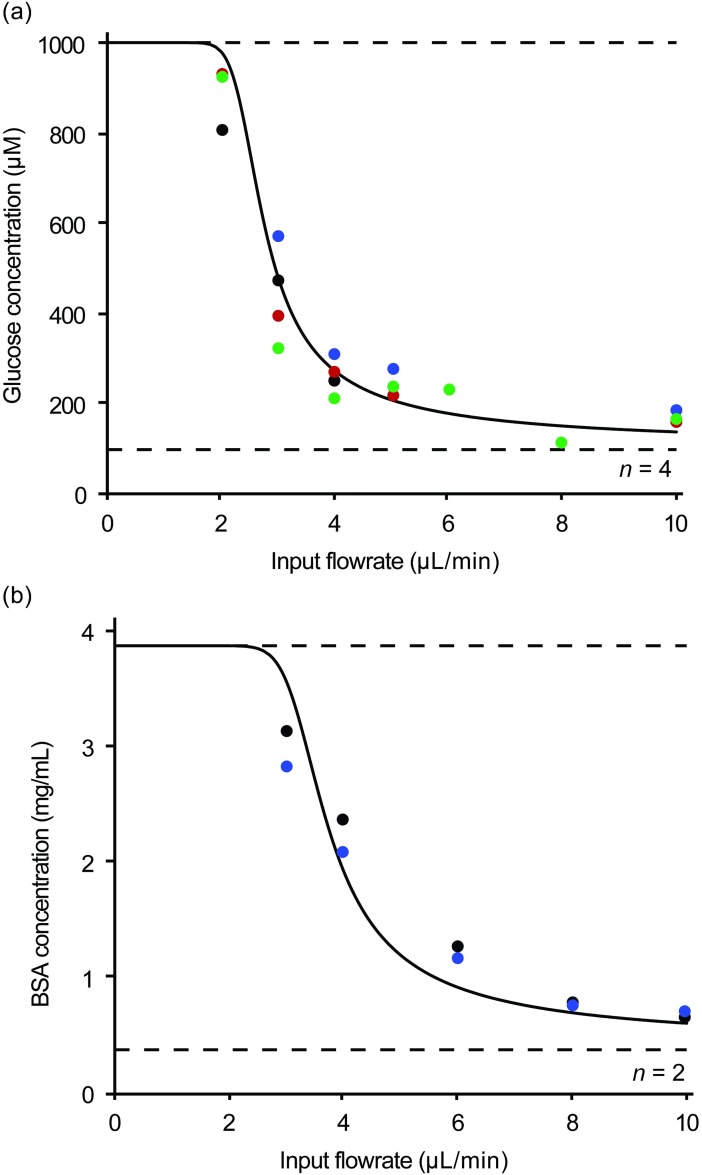
Fig 4. Predicted and recorded concentration profiles of biologically-relevant analytes at varying flowrates.
The concentrations at various input flowrates are shown for two biologically-relevant analytes: glucose and BSA. Concentrations are predicted by the in-silico model and plotted for each analyte.

