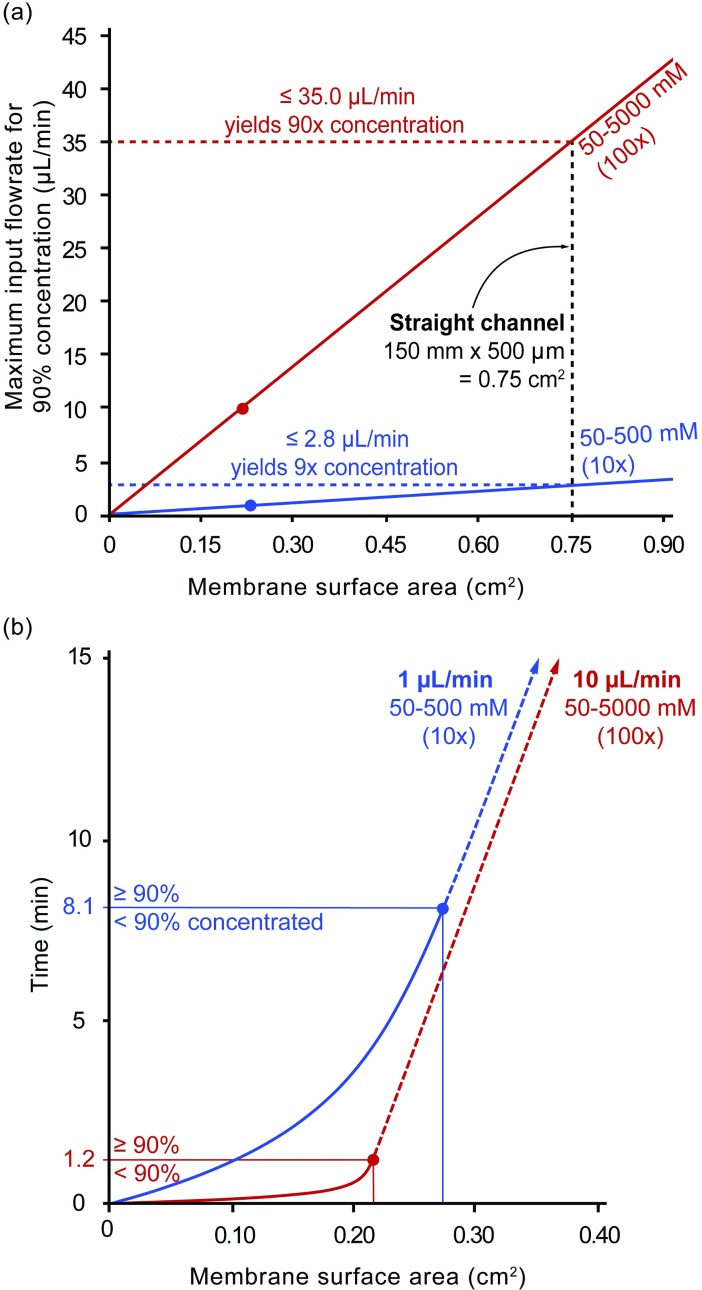
Fig 5. In-silico model predictions for design constraints and considerations.
(a) The in-silico model predicts a linear proportionality between membrane surface area (cm2) and the maximum input flowrate that is capable of concentrating to 90%. (b) The time (min) needed to for the sample to travel over a given membrane surface area (cm2) as predicted by the in-silico model.

