Figure 2.
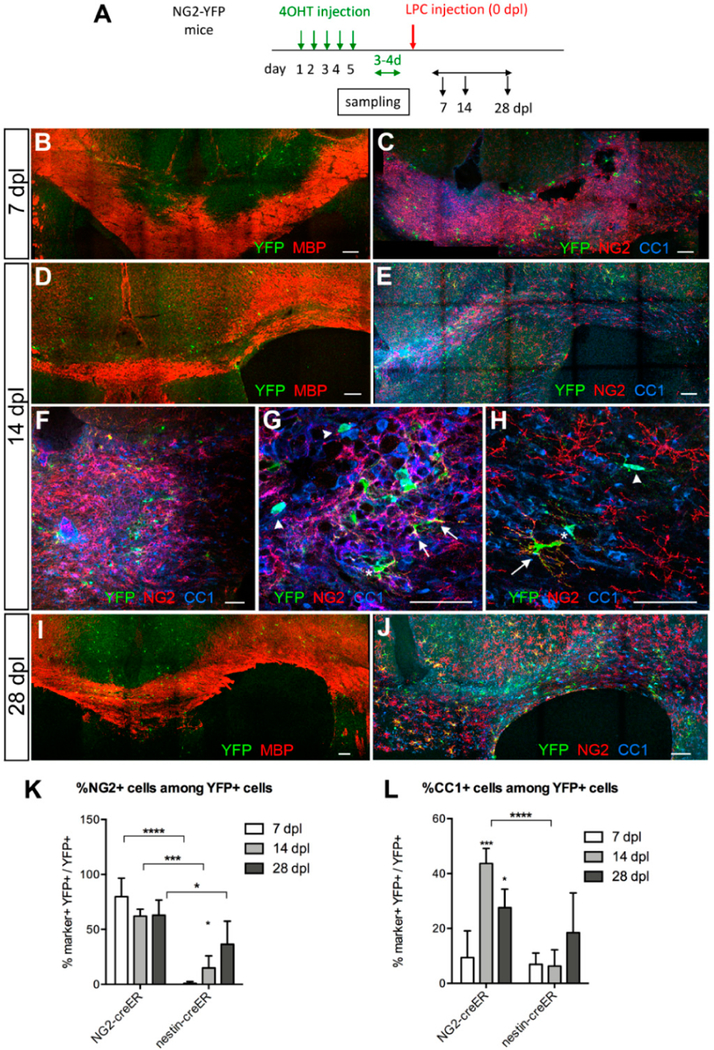
Response of local oligodendrocyte precursor cells (OPCs) to LPC-induced demyelination in the corpus callosum. (A) Scheme showing the experimental outline. (B,C) Lesion at 7 dpl. Low magnification images of immunolabeling for MBP and yellow fluorescent protein (YFP) showing an area of demyelination (B) and immunolabeling for YFP, NG2, and CC1 showing scattered YFP+NG2+ cells in the lesion (C). (D–H) Lesion at 14 dpl. Low magnification images of immunolabeling for MBP and YFP showing partially remyelinated lesion (D), characterized by uneven MBP staining, and immunolabeling for YFP, NG2, and CC1 showing increased number of YFP+ cells in the lesion (E,F). Higher magnification shows a significant proportion of YFP+ cells express CC1 (arrowheads), while other YFP+ cells are NG2+ (arrows). Some YFP+ cells express both NG2 and CC1 (asterisks) at varying ratios. (G) is a higher magnification of the lesion. (H) is from a site further away from the lesion. (I,J) Lesion at 28 dpl. Immunolabeling for MBP and YFP shows largely repaired lesion (I) and a cluster of YFP+CC1+ cells in the center of the repaired lesion while YFP+ NG2+ cells are seen at the periphery (J). Scale bars: 100 μm for (B–F) and (I,J); 50 μm for (F–H). (K,L) The proportion of YFP+ cells that were NG2+ (K) or CC1+ (L) in Tg(Cspg4-creERTM;gt(ROSA)26Sortm1(EYFP) (NG2-YFP) and Tg(Nes-creERT2);gt(ROSA)26Sortm1(EYFP) (nestin-YFP) mice. * p < 0.05, *** p < 0.001, **** p < 0.0001. n = 3, two-way ANOVA, uncorrected Fisher’s least significant difference (LSD) test.

