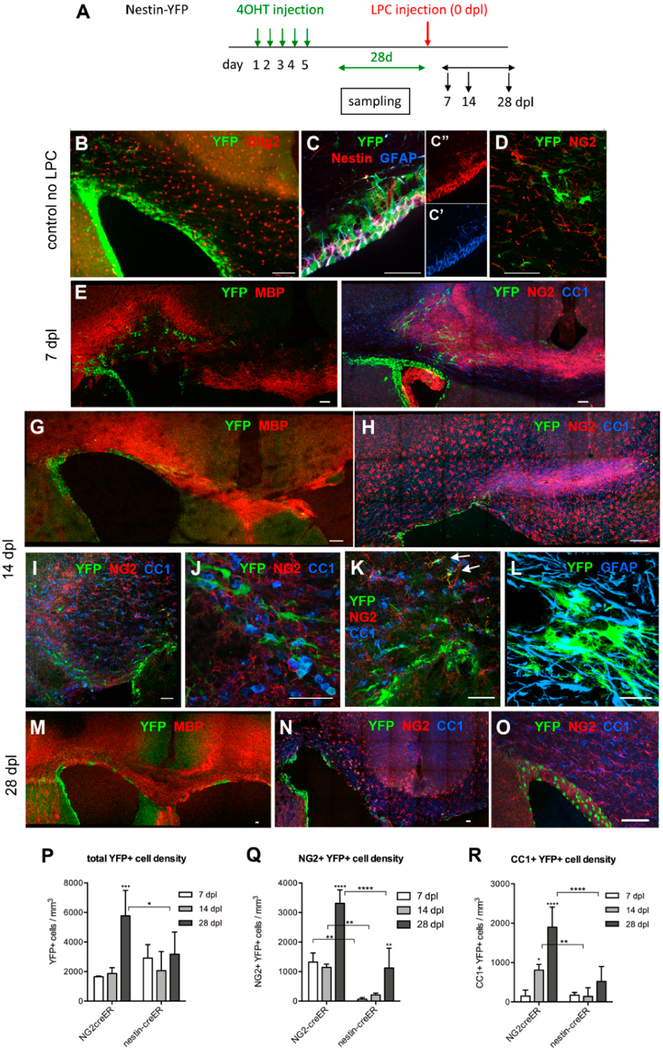
Figure 3.
Response of subventricular zone (SVZ) cells to LPC-induced demyelination in the corpus callosum. (A) Scheme showing the experimental outline. (B–D) The distribution and phenotype of YFP+ cells prior to LPC injection. The majority of the YFP+ cells are found in the SVZ (B) and very few of the YFP+ cells expressed Olig2. The majority of the YFP+ cells expressed nestin and GFAP (C) but not NG2 (D). (E,F) Lesion at 7 dpl. Low magnification images of MBP and YFP immunolabeling showing an area of demyelination with YFP+ cells mostly above the lateral ventricle (E) and immunolabeling for YFP, NG2, and CC1 showing that most of the YFP+ cells are neither NG2+ nor CC1+. There is strongly upregulated NG2 immunoreactivity throughout the lesion. Note that YFP+ cells line the SVZ. Some YFP+ cells appear to be migrating toward the needle track (arrows). (G–L) Lesion at 14 dpl. Low magnification of immunolabeling for MBP and YFP showing partially remyelinated lesion (G) and immunolabeling for YFP, NG2, and CC1 showing a slightly increased number of YFP+ cells in the lesion (H). Higher magnification shows that most of the YFP+ cells were confined to the lesion border (I). Higher magnification of I shows that most of the YFP+ cells did not express NG2 or CC1. (J) A region from the periphery of the lesion above the lateral angle of SVZ showing two YFP+ NG2+ cells (arrowheads). Some of the large, YFP+ cells were glial fibrillary acidic protein (GFAP)+ (L). (M–O) Lesion at 28 dpl. YFP and MBP labeling show remyelinated lesion with increased YFP+ cells in the lesion (M) and that the majority of the YFP+ cells were NG2+ (N). (O) Control mouse injected with PBS and stained for YFP, NG2, and CC1 at 28 dpl, showing that the majority of the YFP+ cells are confined to the SVZ and few YFP+ cells were detectable in the corpus callosum. Scale bar: 50 μm. (P–R) The density of YFP+ cells (P), YFP+ NG2+ cells (Q), and YFP+ CC1+ cells at 7, 14, and 28 dpl in NG2-YFP and nestin-YFP mice. * p < 0.05, ** p < 0.01, *** p < 0.001, **** p < 0.0001. n = 3–4, two-way ANOVA, uncorrected Fisher’s LSD.

