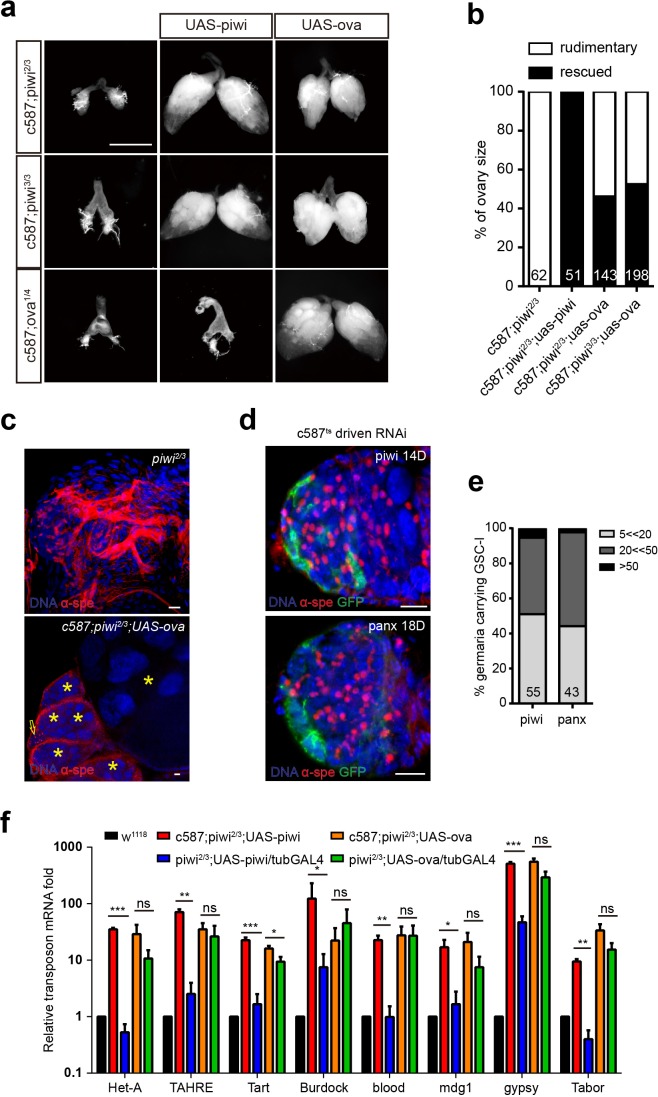
Figure 2. Ova acts downstream of Piwi genetically.
(a) Phase contrast images of dissected ovaries from flies of indicated genotypes. Scale bar, 500 µm. (b) A graph shows the percentages of germaria with rudimentary or rescued ovaries (n = 62, 51, 143, 198 respectively). (c) Confocal sections of piwi2/3 and ova-rescued ovaries. Arrow indicates the GSC-like tumor; asterisk indicates the developing germline cyst. Red, α-Spectrin. Scale bars, 10 µm. (d) Confocal sections of piwi RNAi and panx RNAi germaria. Red, α-Spectrin. Scale bars, 10 µm. (e) Quantification of GSC-like cell number in germaria of indicated genotypes. (n = 55, 43 respectively). f, qPCR result of TE levels in total ovarian RNA from indicated genotypes (normalized to actin5c). Values are means ± SEM.; n = 3. P values by two-tailed t-test (*, p<0.05; **, p<0.01; ***, p<0.001).

