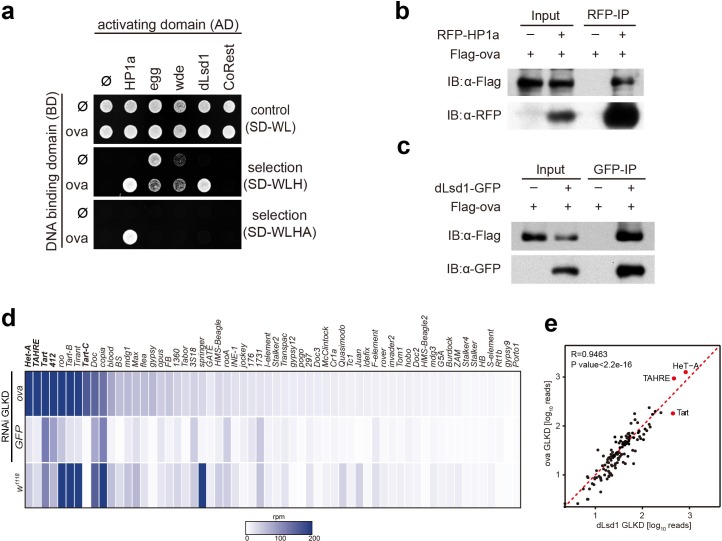
Figure 3. Ova interacts with the heterochromatin machinery.
(a) Y2H assay for protein interaction between Ova and proteins as indicated. (b–c) Western blots showing reciprocal co-IP between Ova and HP1a, and between Ova and dLsd1. The RFP-HP1a transgene was driven by the endogenous promoter. The dLsd1-GFP transgene was driven by a ubiquitous promoter. The Flag-ova transgene was driven by nos-GAL4. (d) Heat map displaying steady state mRNA levels as reads per million (rpm) for the top 60 detected transposons in nosGAL4 driven ova-RNAi, EGFP-RNAi, and w1118 ovaries. The average of three replicates is shown. The most upregulated transposons are highlighted in bold. (e) Correlation scatter plot of log10 transposon mRNA-seq reads between ova GLKD and dLsd1 GLKD ovaries. R = 0.9463, p<2.2×10⁻¹⁶ by Pearson’s correlation coefficient. The most upregulated transposons in both genotypes are highlighted in red dots.
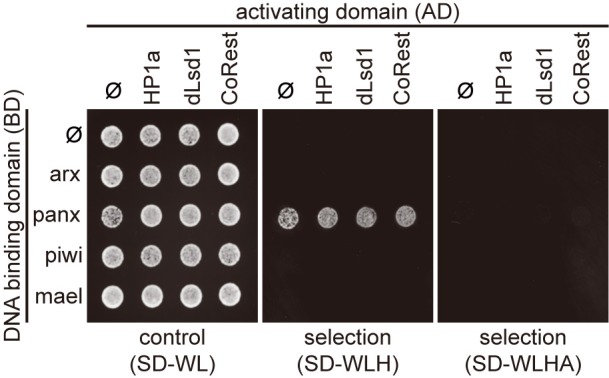
Figure 3—figure supplement 1. Protein interaction mapping among components of heterochromatin machinery by Y2H assay.


