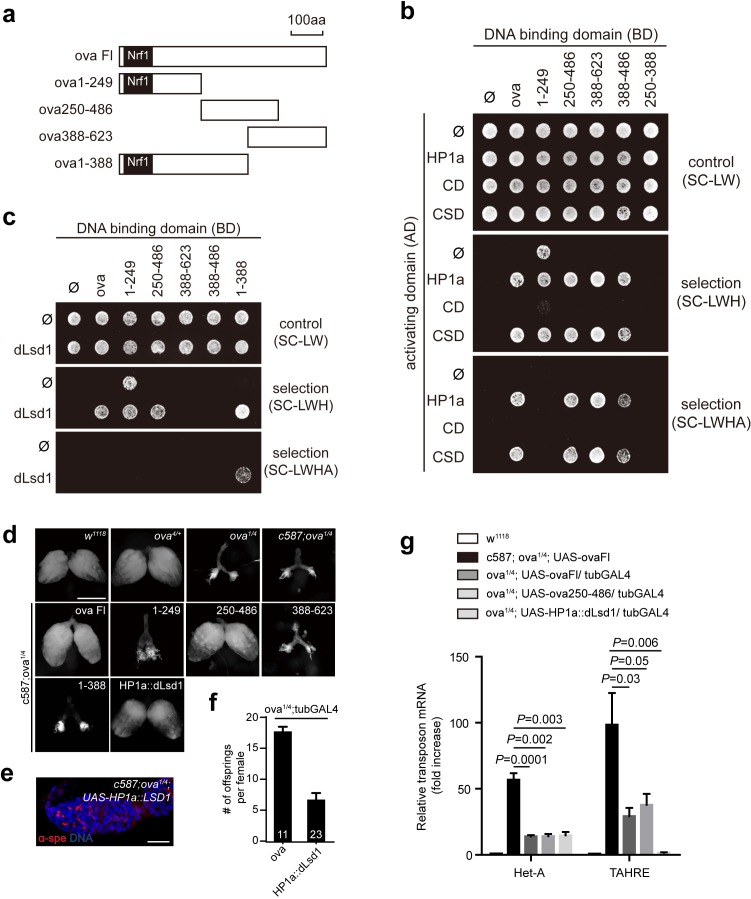
Figure 4. Ova acts as a protein adaptor to link dLsd1 with HP1a.
(a) Schematic drawings of full length and truncated forms of Ova. (b) Mapping the reciprocal-binding regions between HP1a and Ova by Y2H assay. (c) Mapping the reciprocal-binding regions between HP1a and dLsd1 by Y2H assay. (d) Ovaries from flies of indicated genotypes. Escort cell-specific expression of ova full length, ova250-486 or HP1a::dLsd1 rescued ova1/4 ovary defect. Scale bar, 500 µm. (e) A representative image of ova1/4 germarium rescued by escort cell-specific expression of HP1a::dLsd1. Red, α-spectrin; Blue, DAPI. Scale bar, 10 µm. (f) A graph shows the total offspring number of indicated females (n = 11, 23 respectively). (g) A graph shows fold changes of TEs in total ovarian RNA from indicated genotypes (normalized to actin5c). Values are means ± SEM.; n > 4. P values by two-tailed t-test.
Figure 4—figure supplement 1. HP1a::dLsd1 expression rescues ova loss induced derepression of protein-coding genes.


