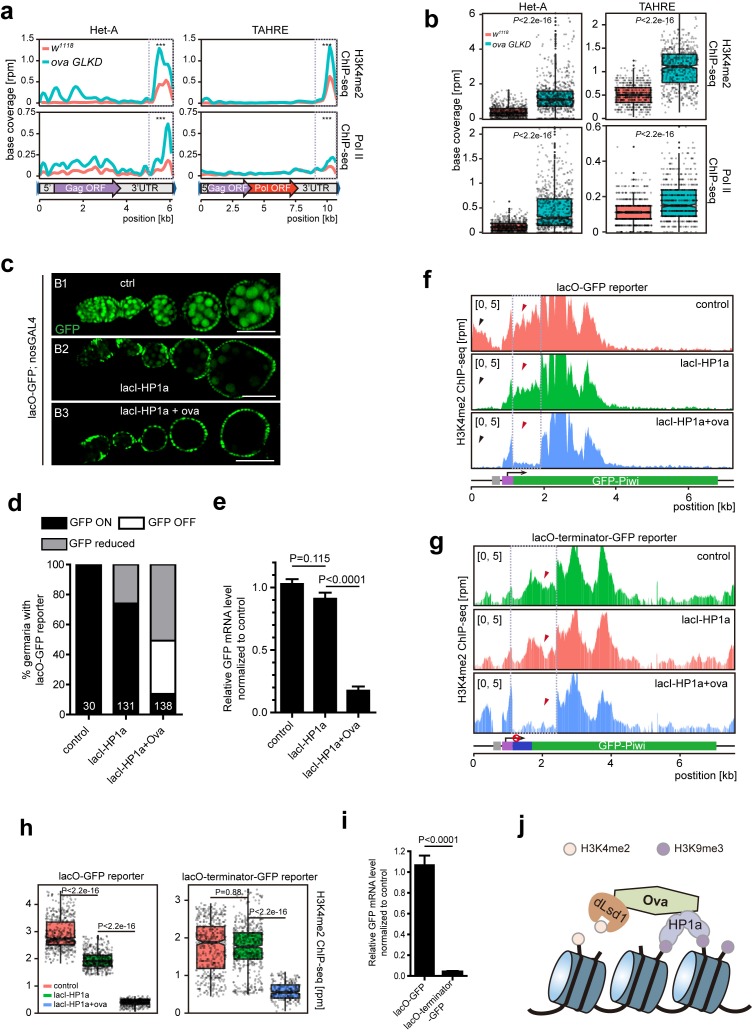
Figure 5. Ova regulates HP1a-induced local H3K4 demethylation.
(a) Graphs showing H3K4me2 and Pol II ChIP-seq profiles mapped to indicated transposon loci in control versus ova GLKD ovaries. Dashed boxes, enhancer regions of transposons. RPM, reads per million. Bin, 100 bp. (b) Quantitative comparison of H3K4me2 and Pol II densities in the indicated enhancer regions in 5a (dashed boxes). P values by two-tailed Student’s t-test. (c), Ovarioles with indicated genotypes expressing ubiquitous lacO-GFP reporter in the germline cells. GFP was visualized by antibody staining. Scale bar, 50 µm. (d) A graph showing the percentage of ovarioles of indicated genotypes with normal, reduced, or abolished GFP signals. (e) Quantitative RT-PCR results of GFP mRNA from ovaries of indicated genotypes. Values are means ±SEM.; n > 4. P values by two-tailed Student’s t-test. (f) Graphs showing normalized H3K4me2 density mapped to lacO-GFP reporter region from ovaries of indicated genotypes. Grey box, lacO-binding sites; Purple box, nanos promoter. (g) Graphs showing normalized H3K4me2 density mapped to lacO-terminator-GFP reporter region from ovaries of indicated genotypes. Blue box, VASA terminator. (h) Quantitative comparison of H3K4me2 density in regions indicated by the dashed boxes in f or g. P values by two-tailed Student’s t-test. (i) Quantitative RT-PCR results of GFP mRNA from lacO-GFP and lacO-terminator-GFP reporter ovaries. Values are means ± SEM.; n = 4. P value by Student t-test. (j) A schematic model for Ova function: Ova functions as a protein adaptor to link HP1a with dLsd1 for local H3K4 demethylation during HP1a-induced transcriptional gene silencing.
Figure 5—figure supplement 1. Comparison of H3K4me2 density on all transposons in w1119 and ova GLKD ovaries.


