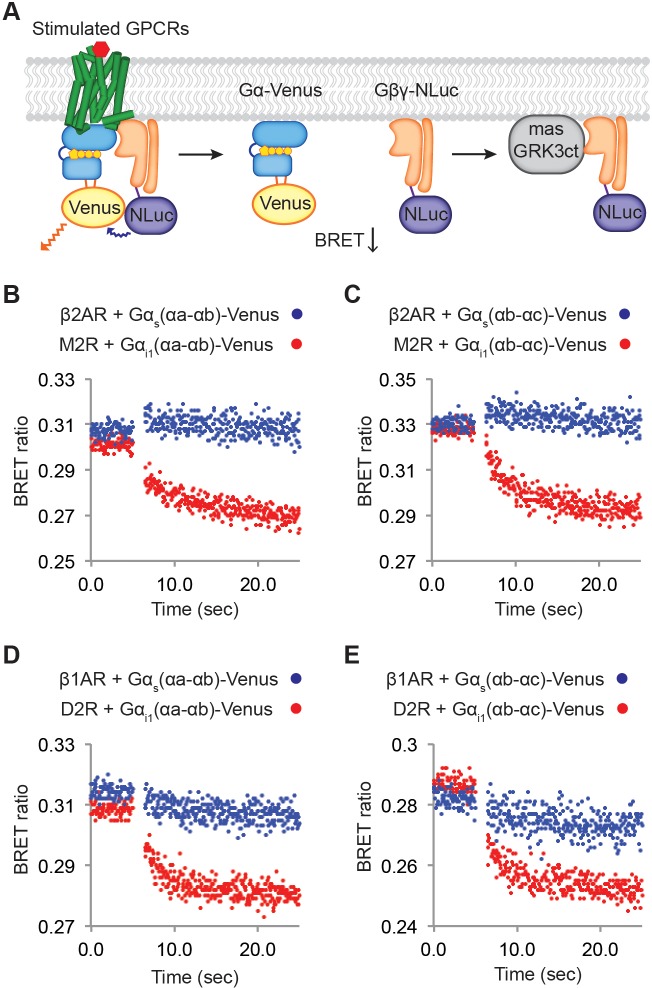
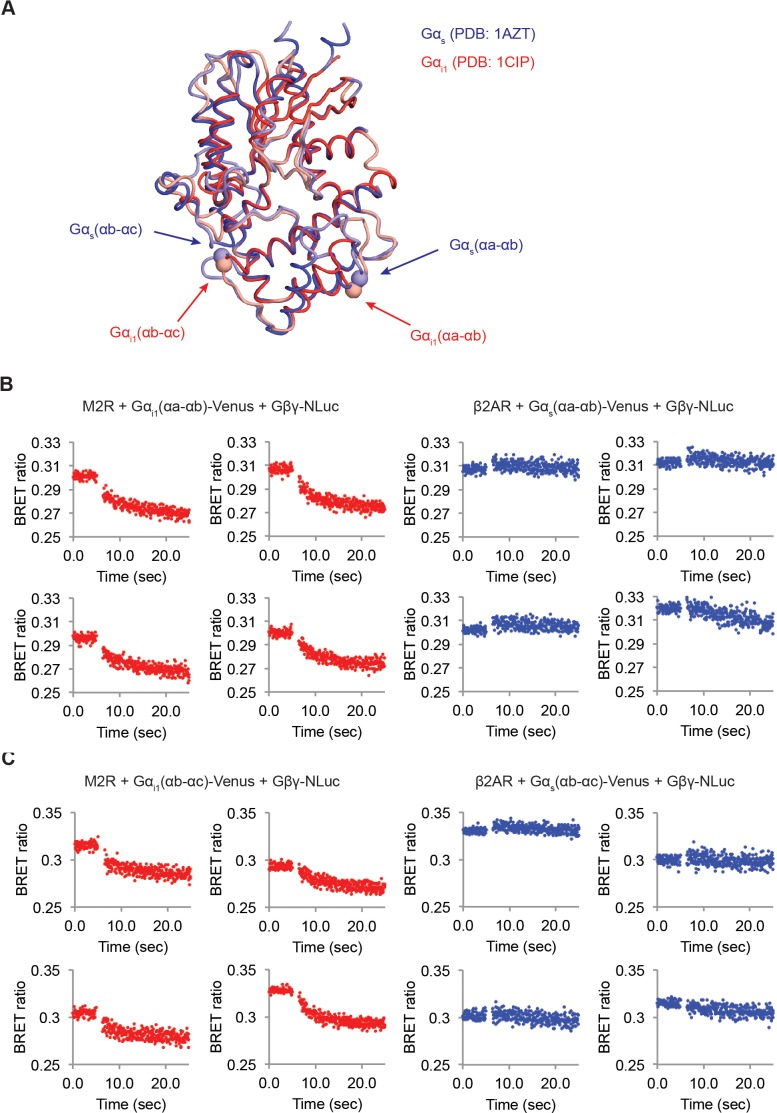
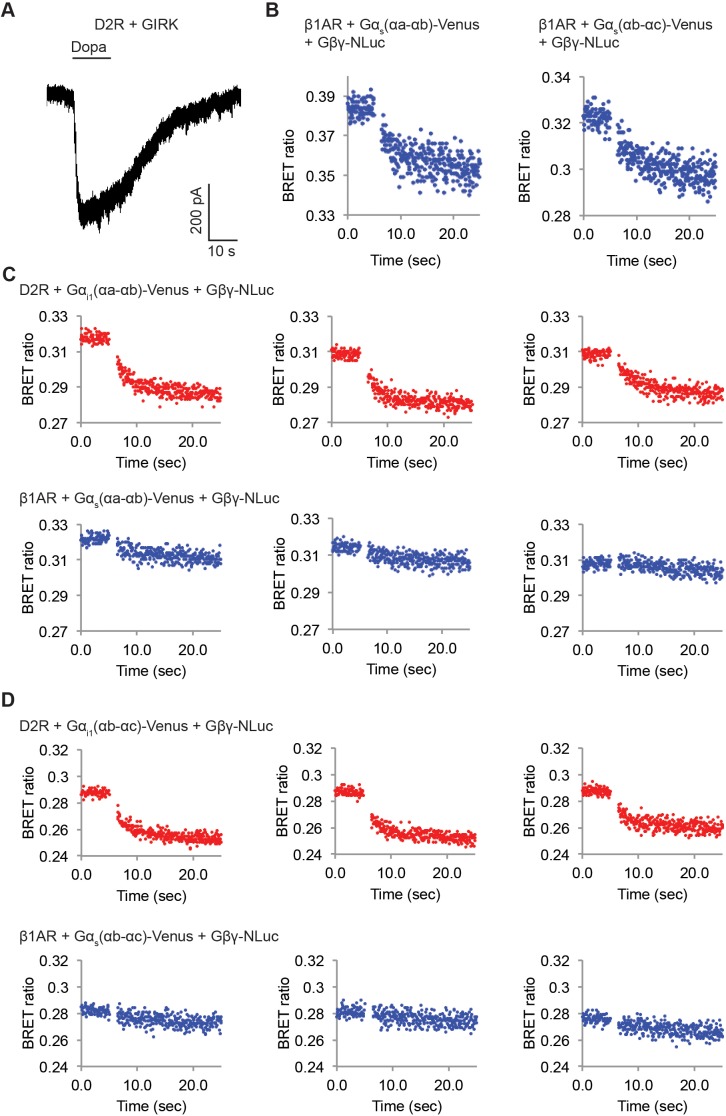
Figure 6. Relative rates of Gβγ release by Gαi versus Gαs-coupled receptors.
(A) A schematic representation of the experiment that monitors Gβγ release by BRET. Upon agonist stimulation, GPCRs release Gα and Gβγ. The dissociation of Gα-Venus and Gβγ-NLuc results in a decrease of the BRET signal. Released Gβγ-NLuc was chelated by masGRK3ct, a fusion of the C-terminal PH domain of GRK3 and a myristic acid attachment peptide. (B)-(E) Representative time-resolved BRET ratio curves. In (B) and (C), M2Rs released more Gβγ than β2ARs did within the same time period, independent of which Gα-Venus construct was used. In (D) and (E), D2Rs released more Gβγ than β1ARs did within the same time period, independent of which Gα-Venus construct was used. See also Figure 6—figure supplements 1 and 2, and Table 1.


