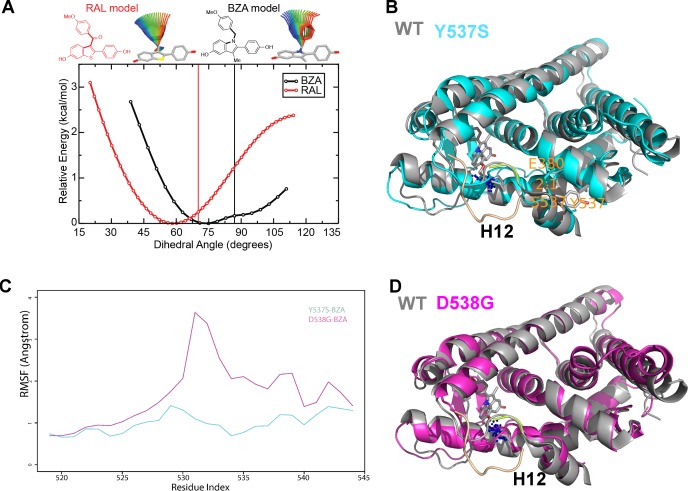
Figure 7. (A) QM scan of RAL and BZA arm torsion angle energetics.
(B) Overlaid representative calculated structure of Y537S-BZA (cyan) closest to the last 50-ns average from molecular dynamics (MD) simulation and the WT-BZA structure, vertical lines represent the ligand binding conformation in the X-ray crystal structure. Nitrogen atoms of the azepane part of BZA for the last 50-ns MD ensemble are shown in blue spheres near H12. Loop H11-12 is also shown for crystal structures of WT-4-OHT (wheat; PDB: 3ERT) and D538G-4-OHT (yellow; PDB: 4Q50). (C) Root mean squared fluctuations of ERα LBD residues, including the C-end of H11 (resi. 519–527), the loop H11-12 (resi. 528–535), and H12 (resi. 536–544), in the last 50-ns MD simulations for Y537S-BZA (cyan) and D538G-BZA (magenta). (D) Overlay of a representative structure of D538G-BZA (magenta) from MD simulations and the same WT-BZA structure (gray) as in (B).

